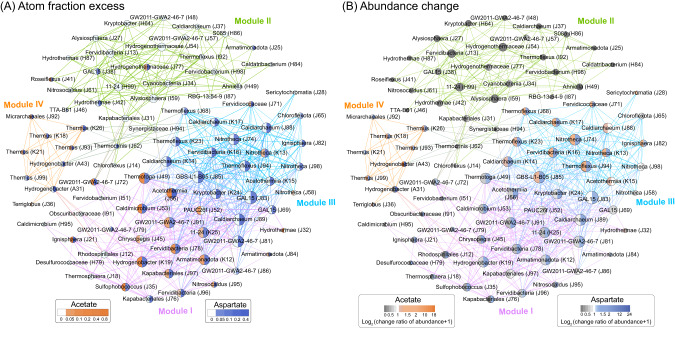
Fig. 3. Co-occurrence network analysis based on Spearman correlation.
Connections represent strong (Spearman’s rho >0.7) and significant (p < 0.01) correlations. Four modules were evident (modularity index >0.415), and each module is distinguished by different line colors. The sizes of nodes are proportional to the number of connections (i.e., number of connections). A Nodes are colored based on assimilation of 13C from 13C-aspartate and 13C-acetate (13C atom fraction excess), or (B) the log2-fold change in absolute abundance. To avoid the logarithm of zeros on the horizontal axis, zero values are indicated as change ratio of abundance +1. The labels show the genus, or the lowest taxonomic rank assigned above genus. The average degree of this network is 7.843, average path length is 2.67, and the clustering coefficient 0.688.

