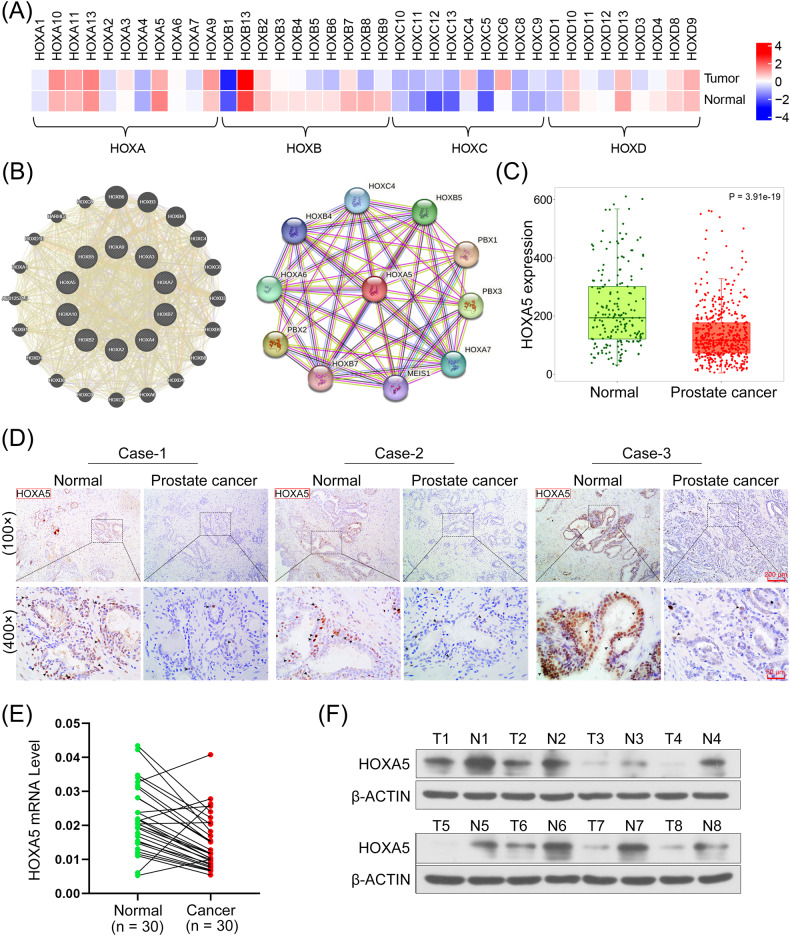
Fig. 1. Homeobox A5 (HOXA5) levels are decreased in human prostate cancer (PCa) tissues.
A The clustering heatmap for HOX gene expression profile between PCa tissues and the corresponding normal samples. B The gene-gene interaction network of HOX genes based on generated GeneMANIA and STRING. C Data about HOXA5 expression in PCa tissues and normal prostate samples were obtained from the The Cancer Genome Atlas (TCGA) dataset based on the TNMplot database. D Representative images of IHC staining of HOXA5 on paired normal and prostate cancer tissue samples. Images were taken at 100× and 400× magnifications. E HOXA5 mRNA level in paired PCa tissues and adjacent normal tissues. F Representative images of HOXA5 expression detected by Western Blot assay. *P < 0.05, **P < 0.01. Results were presented as mean ± SD.

