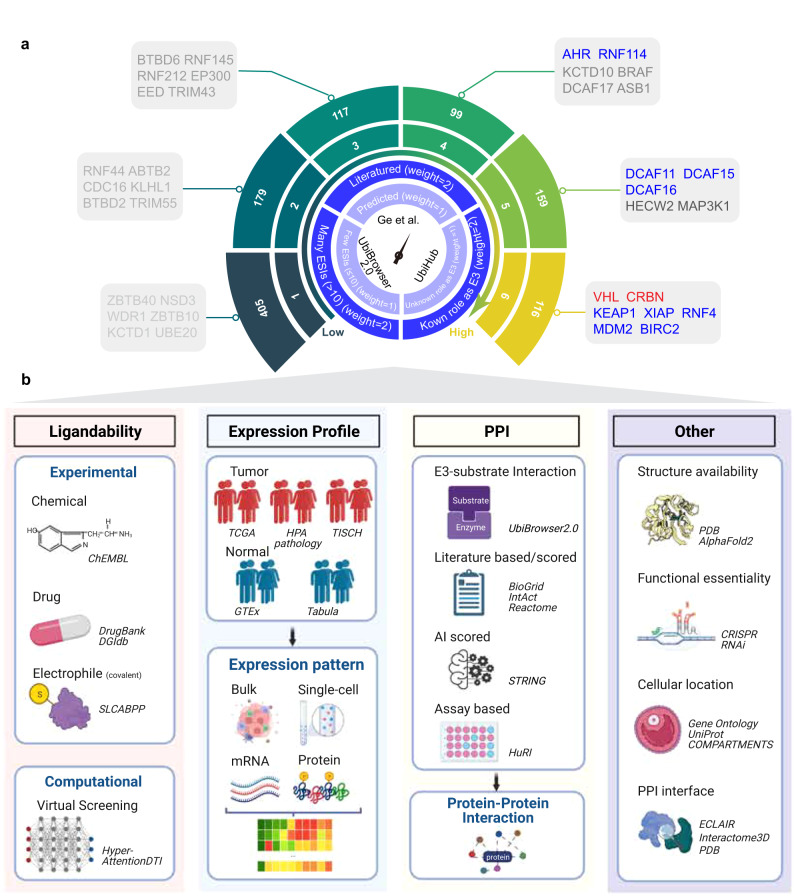
Fig. 1. Schematic workflow of collecting and annotating E3 ligases.
a Illustration of collecting and scoring E3 ligases in inner circle, while the distribution of scores of E3 ligases and co-opted E3 ligases in outer circle. E3 ligases in red were proceeded to PROTAC clinical trials. E3 ligases in blue were explored in PROTAC experiment. b We comprehensively characterized E3 ligases chemical ligandability, expression patterns, protein–protein interactions (PPI), structure availability, functional essentiality, cellular location, and PPI interface. Created with BioRender.com.

