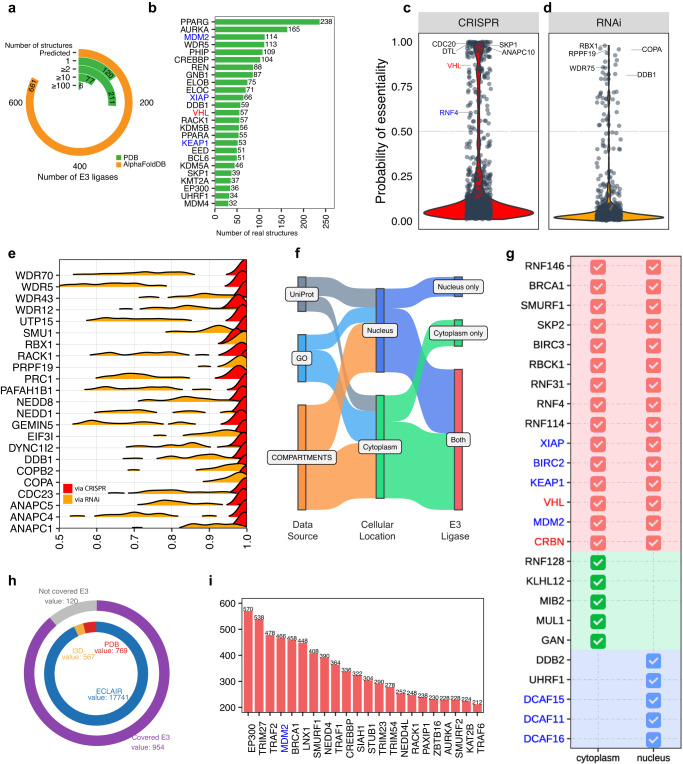
Fig. 6. Structure availability, functional essentiality, and cellular location of E3 ligases.
a Distribution of the number of available structures of E3 ligases. b The number of protein structures of E3 ligases. c, d Distribution of mean of the probability of essentiality of E3 ligases by CRISPR and RNAi. e Ridgeplot showing the distribution of tumor-essential E3 ligases in both datasets. f Sankey plot showing cellular localization of E3 ligases from different data sources. g The cellular localizations of E3 ligases. h Outer ring showing E3 ligases with available PPI interface and inner ring showing the distribution of origins of PPI interface. i E3 ligases with top number of PPI interfaces. E3 ligases in red were proceeded to PROTAC clinical trials. E3 ligases in blue were experimentally explored in PROTAC experiment.

