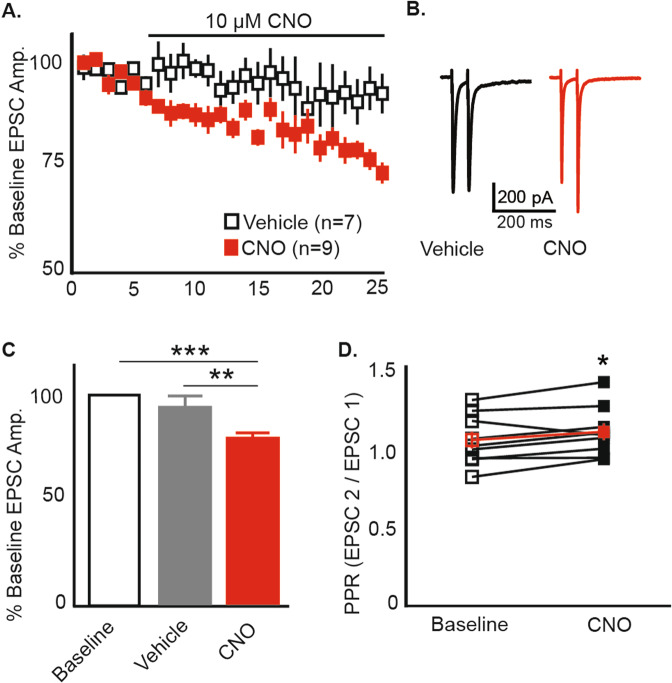
Fig. 4. Whole-cell patch-clamp recordings from nucleus accumbens medium spiny neurons (MSNs) verify hM4Di function.
A Graph showing mean % of baseline EPSC amplitude over 25 min for 16 cells following bath application of 10 μM CNO (n = 9) or vehicle (n = 7). CNO application depresses EPSC amplitude as compared to vehicle. B Representative traces following vehicle (left) or CNO (right). C Statistical analysis of baseline (first 5-min) compared to the last 5 min of recording. CNO significantly reduces EPCS amplitude as compared to baseline (P = < 0.001) and compared to the last 5 min of recording in the vehicle and CNO recordings (P = 0.008). D Paired-pulse ratio increases following CNO application over baseline (P = 0.041), suggesting that CNO application decreases the probability of glutamate release. Each point represents a single cell; red points indicate mean +/− SEM. Error bars indicate +/− SEM. *P ≤ 0.05, **P < 0.01, ***P < 0.001.

