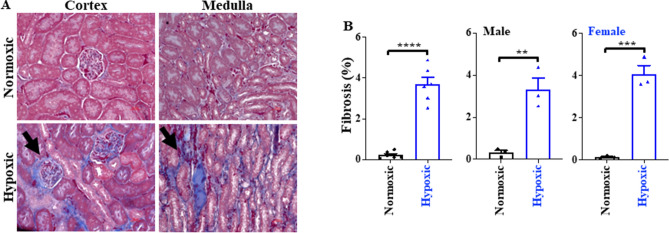
Figure 1.
Masson’s trichrome staining. (A) Representative images of the cortex and medulla of the kidney under hypoxic and normoxic conditions. (B) Bar graphs represent the quantification of fibrosis and illustrate significant fibrosis in male and female mice due to hypoxia. N = 6 for hypoxic kidneys and N = 6 for normoxic kidneys from independent mice. Male mice were 3 each in the normoxic and hypoxic groups; similarly, female mice were 3 each in normoxic and hypoxic groups. **p < 0.01; ***p < 0.001.

