
Fig. 6. Transconjugant sorting and ARG analysis.
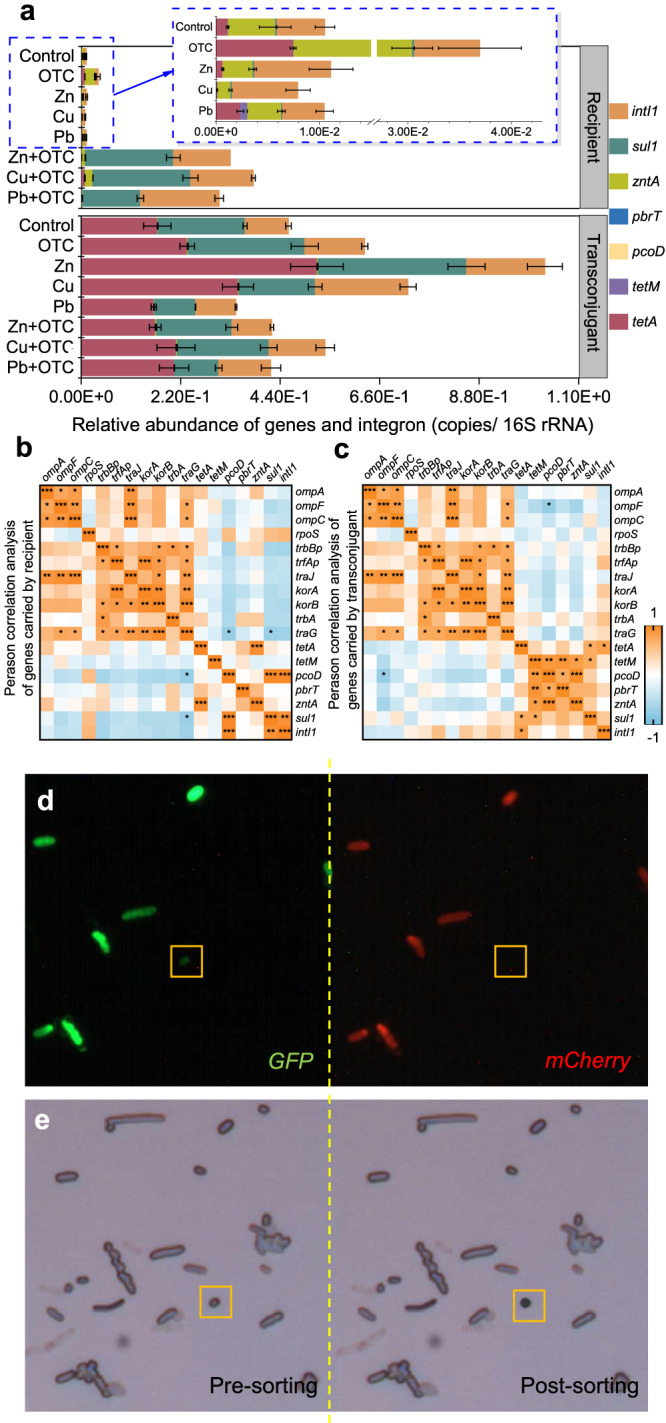
a Relative abundance of genes and integron in transconjugants and recipients. b Correlation analysis of genes carried by recipient. c Correlation analysis of genes carried by transconjugant. d Confocal fluorescence image of microbiota through GFP (green) and mCherry (red) models was collected and imaged. e Bright-field views before and after cell sorting. Significant correlations (b, c) between each gene were analyzed with Pearson correlation analysis: *(p < 0.05), **(p < 0.01) and ***(p < 0.001).