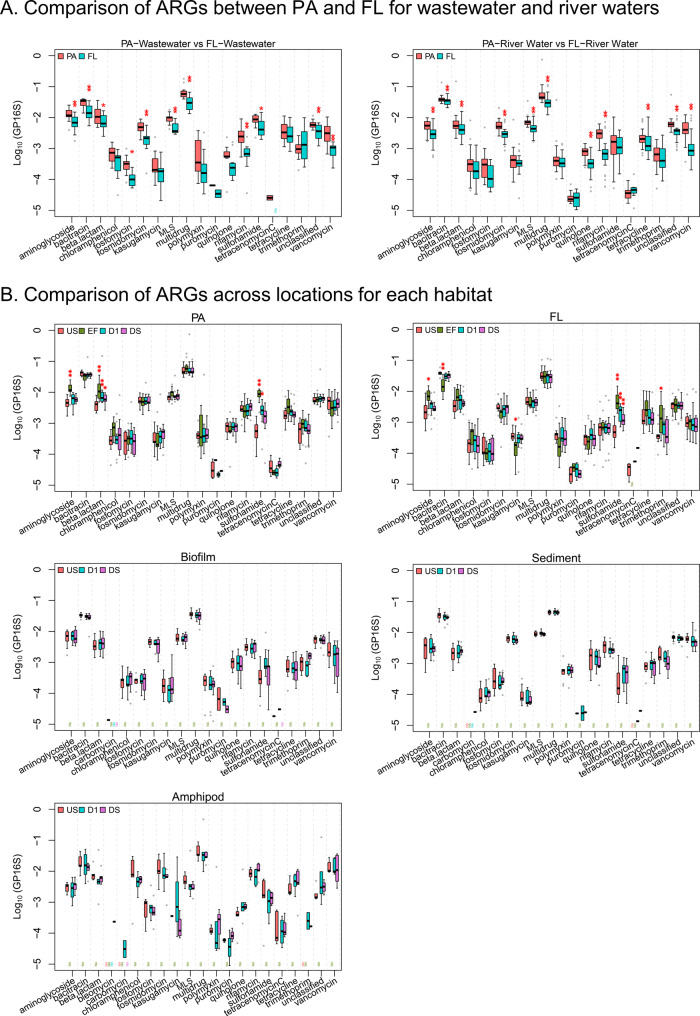
Fig. 4. Relative abundances of class-level aggregated ARGs that were identified by metagenomic analysis for each compartment.
A Comparison between particle-associated (PA) and free-living (FL) biomass from wastewater (EF; left) and river water (US, D1, and DS; right). B Occurrences of ARGs in the different habitats: PA, and FL fraction of water, biofilm, sediment, and freshwater amphipod gut. The asterisks (‘*’ indicates p < 0.05; ‘**’ indicates p < 0.01) indicate significant differences between PA and FL (for A), or between US versus the other locations (EF, D1, and DS). MLS indicates macrolide-lincosamide-streptogramin (for B). The ARG classes that occurred in at least one of the locations (US, EF, D1, or DS) were shown for each habitat.

