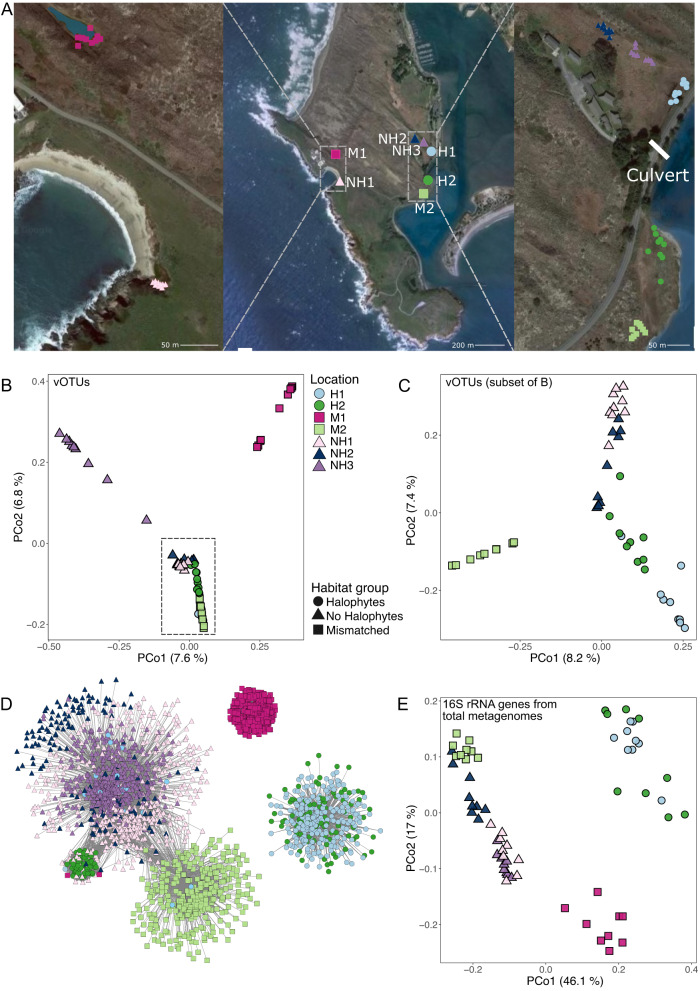
Fig. 1. Sampling design and overarching compositional patterns for Bodega Bay viral and prokaryotic communities.
A Sampling locations for all Bodega Bay samples. Center: locations of the seven wetland sites within the Bodega Marine Reserve, Left and Right: locations of each of the nine samples per site (a zoomed in view of each site with individual sample labels is in Supplementary Fig. 1). Per the legend below the images, circles correspond to locations with halophyte vegetation and saline soils, triangles correspond to locations without halophytes and non-saline soil, and squares correspond to mismatched locations. The ‘culvert’ label indicates the location of a human-made pipe below the road that allows for water movement. B, C Principal coordinates analysis (PCoA), based on Bray-Curtis dissimilarities derived from the table of vOTU abundances (read mapping to vOTUs). Each point is one sample (one virome), with viral communities from (B) all 63 viromes, and (C) the 45 viromes indicated by the dashed rectangle in (B). Panel (C) is a new PCoA to better show separation among overlapping samples in (B). D Co-occurrence network of vOTUs detected in more than one Bodega Bay virome, colored by the site in which they were most abundant (had the highest average per-bp coverage depth). Nodes represent vOTUs, and edges represent a significant co-occurrence between the vOTUs, calculated using a probabilistic co-occurrence model with the R package cooccur. E PCoA based on Bray-Curtis dissimilarities of 16S rRNA gene OTU community composition, where 16S rRNA gene reads were bioinformatically mined from 63 total metagenomes. For all PCoA plots (B, C, E), the percent variance explained by each axis is indicated in parenthesis.

