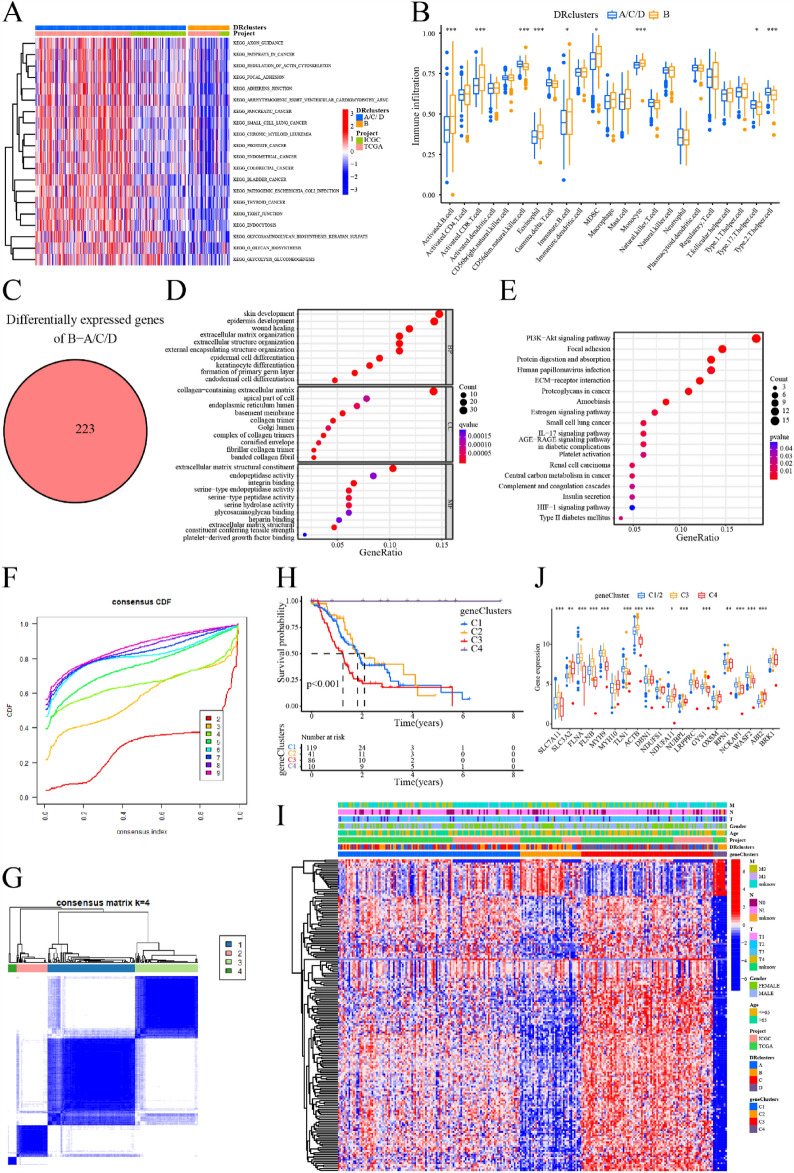
Figure 3.
Obtain the DEGs between DRclusters and identify geneClusters. (A) GSVA analysis of DRclusters. (B) Analysis of immune cell infiltration in DRclusters by ssGSEA. (C) Identification of DEGs between DRclusters. (D, E) GO/KEGG enrichment analysis of DEGs. (F, G) Consensus clustering analysis based on DEGs to obtain geneClusters indicated that the optimal number of subtypes was 4. (H) Kaplan–Meier survival curve analysis of geneClusters. (I) Heatmap of DEGs expression in geneClusters. (J) Expression levels of DRGs in geneClusters. ***: < 0.001; **: < 0.01; *: < 0.05; ns: > 0.05.

