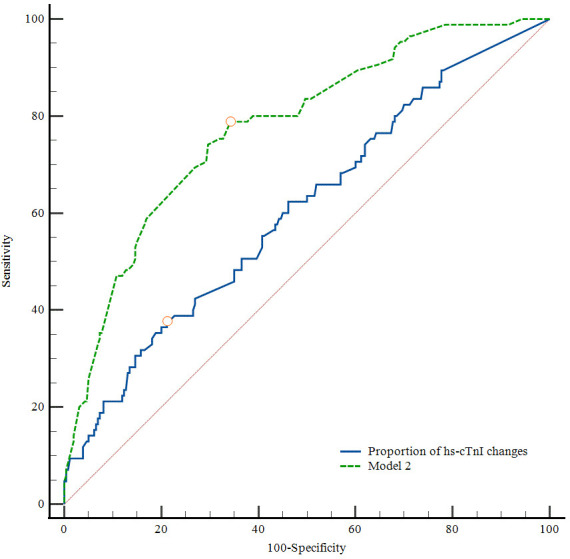
Figure 2.

ROC curves of proportions of high-sensitivity cardiac troponin I (hs-cTnI) changes and Model 2 for the prediction of mortality in 90 days. hs-cTnI dynamic change (area under the curve (AUC) 0.612; cut-off value 165.93%; Youden index J, 0.173; sensitivity 36.17%; specificity 81.15%, p<0.05). Model 2 (AUC 0.778; cut-off value 0.212; Youden index J, 0.446; sensitivity 78.8%; specificity 65.8%, p<0.05).
