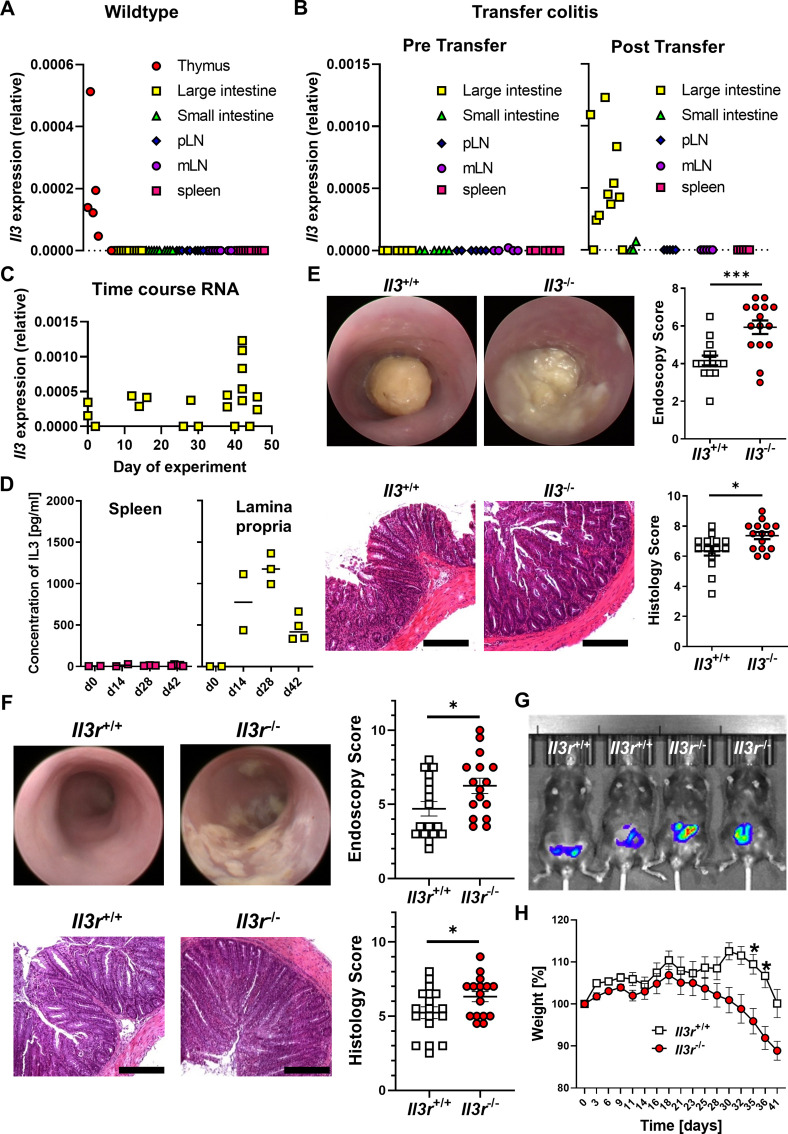
Figure 2.
Il-3 alleviates T cell transfer colitis. (A) Il3 mRNA expression in tissue from various organs of unchallenged C57BL6/J mice as determined by qPCR. n=6–10 per group. (B) Il3 mRNA expression in tissue from various organs of unchallenged Rag1 −/− mice (pre transfer, left, n=5–6) and Rag1 −/− mice with established T cell transfer colitis (post transfer, right, n=3–11) as determined by qPCR. (C) Time course of Il3 mRNA expression in lamina propria mononuclear cells (LPMCs) of Rag1 −/− mice with T cell transfer colitis; n=3–11 per time point. (D) Concentration of Il-3 in supernatants of splenocytes and LPMCs re-stimulated with anti-CD3/28 antibodies at different time points of T cell transfer colitis as determined by ELISA; n=2–5 per time point. (E) Colitis in Rag1 −/− mice after transfer of naïve CD4+ T cells from Il3 +/+ and Il3 −/− mice. Upper panels: mini-endoscopy. Lower panels: histology of colon tissue. Left: representative images (scale bars – 12.5 µm), right: quantitative endoscopic and histological scores of disease severity. n=14–15 per group, unpaired t-test. (F–H) Colitis in Rag1 −/− mice after transfer of naïve CD4+ T cells from Il3r +/+ and Il3r −/− mice. (F) Mini-endoscopy (top) and histology of colon tissue (bottom). Left: representative images (scale bars – 12.5 µm), right: quantitative endoscopic and histological scores of disease severity. n=16–17 per group, Mann-Whitney (endoscopy) and unpaired t-test (histology). (G) Representative in vivo IVIS luminescence imaging of reactive oxygen species after i.p. injection of L-012. (H) Weight course. Normalisation to weight on the day adoptive T cell transfer was performed. n=16–17 per group, mixed-effects analysis with Sidak post hoc test. IL, interleukin; i.p., intraperitoneal; mLN, mesenteric lymph node; mRNA, messenger RNA; MPO, myeloperoxidase; pLN, peripheral lymph node; qPCR, quantitative PCR.

