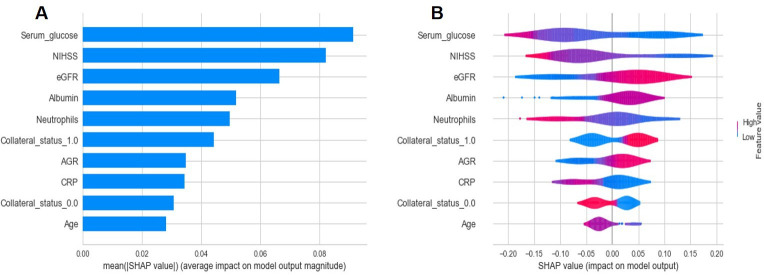
Figure 2.
A,B SHAP summary plot of the impact of the features on the prediction of the PFCML-MT model. (A) Bar chart of the average SHAP value for each predictor. (B) Violin plots. The SHAP values (x-axis) represent the contribution of each predictor (y-axis). Features are ordered according to importance. Collateral status is a categorical variable and was preprocessed with one-hot encoding, thus its SHAP value is presented as ‘collateral_status_1.0’ and ‘collateral_status_0.0’ and its contribution is the sum. AGR, albumin-to-globulin ratio; CRP, C-reactive protein; eGFR, estimated glomerular filtration rate; NIHSS, National Institutes of Health Stroke Scale; SHAP, SHapley Additive exPlanations.

