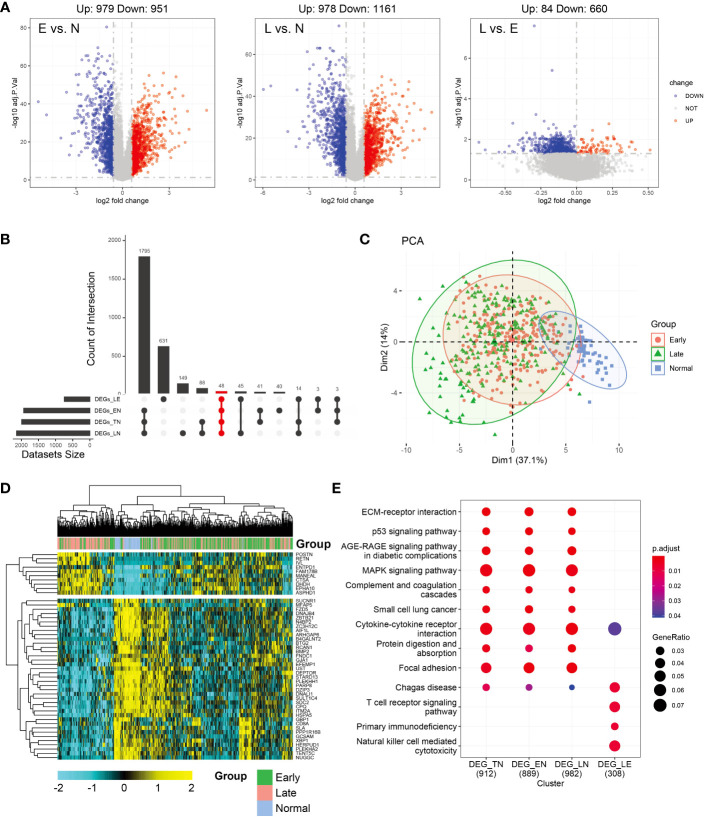
Figure 1.
Analysis of differentially expressed genes (DEGs) in thyroid carcinoma (THCA) in normal and tumor tissues using The Cancer Genome Atlas (TCGA) data. (A) Volcano plot of DEGs of the two stages. The X axis represents the log2 fold-change, and the Y axis represents the negative log transformation of p values. Up- and downregulated genes are indicated by red and blue colors, respectively. Non-DEGs are indicated by grey color. (B) Distribution of samples in the count group of the database. (C) Intersections of DEGs of the two stages were used to cluster the samples. Normal, early-, and late-stage patients are indicated by blue, red, and green, respectively. (D) Heatmap of 47 genes between normal and tumor tissues. (E) Most significant Kyoto Encyclopedia of Genes and Genomes (KEGG) enrichment across normal and tumor subgroup DEGs.

