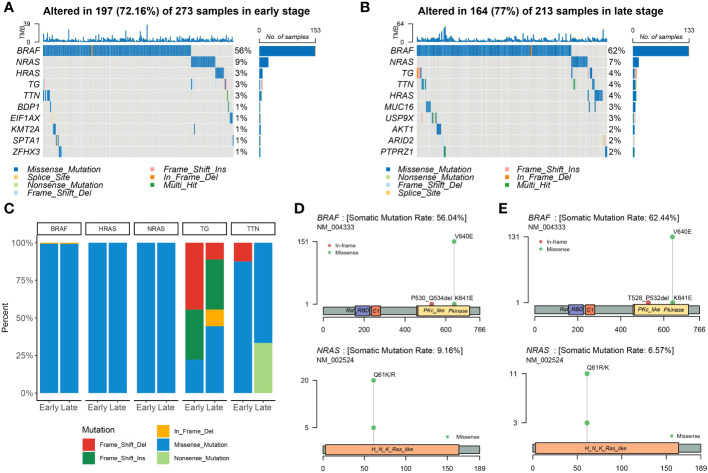
Figure 2.
Landscape of mutations in THCA. Color-coded matrix of individual mutations in the top 10 most mutated genes in early (A)- and late (B)-stage THCA, indicating the number of recurrent mutations in THCA using TCGA data. (C) Stacked bar plot shows the fraction of variant types in the early and late stages. Mutation spots on BRAF and NRAS proteins in early (D) and late (E) stages. The number of mutations in each spot is shown on the Y axis. Mutation types are colored according to the legend.

