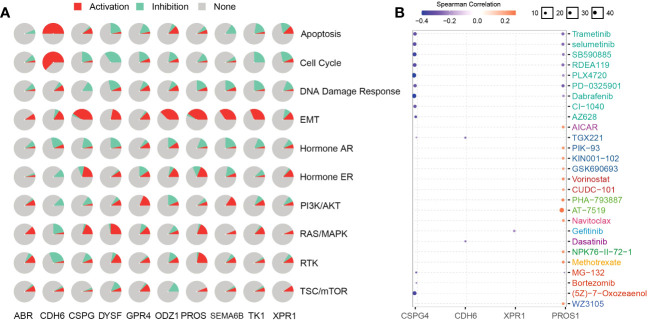
Figure 9.
NRG functions and related drug analysis. (A) Activities of biological pathways identified using NRGs were analyzed using the GSCA database. Red and azure colors represent the percentage of activation and inhibition, respectively. Non-activity is indicated by grey color. (B) NRG-related drugs were obtained using the GSCA database.

