FIGURE 3.
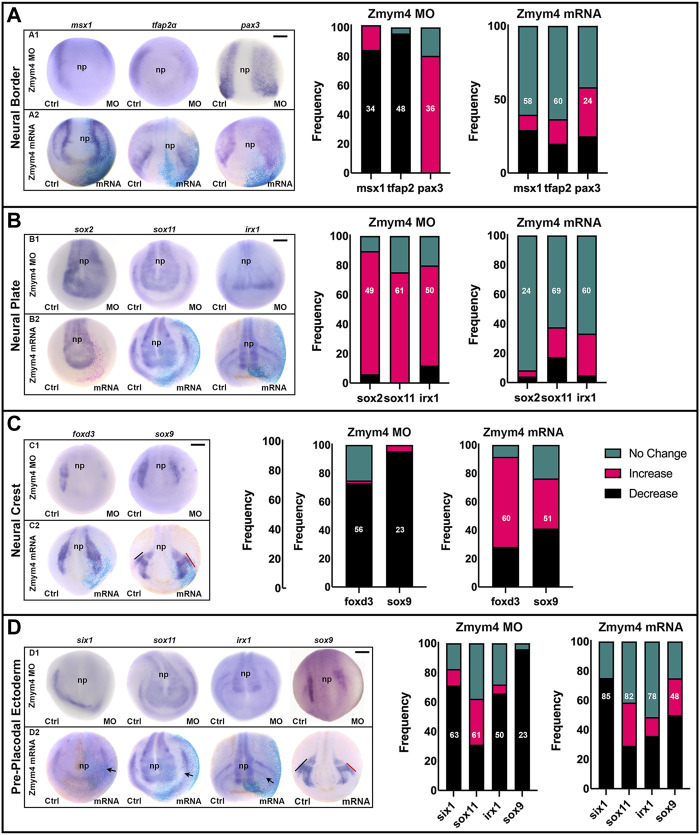
Altering the levels of Zmym4 in embryos differentially altered the expression of early cranial genes. (A) In the neural border zone, knockdown of Zmym4 by MO injection (A1) resulted in decreased expression of msx1 and tfap2α and broader expression of pax3 on the MO-injected side compared to the control (Ctrl) side of the same embryo. Increased expression of Zmym4 by mRNA injection (A2) caused no change in expression in most embryos. The percentages of embryos that showed “no change” (green), “increased” (pink), and “decreased” (black) expression on the injected side compared to the control side of the same embryo are reported in the bar graphs; the number of embryos examined for each gene is indicated within the bar. (B) In the neural plate, knockdown of Zmym4 (B1) resulted primarily in expanded expression of sox2, sox11, and irx1, whereas increased expression of Zmym4 (B2) caused no change in their expression in most embryos. Bar graphs are as in (A). (C) In the neural crest, knockdown of Zmym4 (C1) resulted primarily in reduced expression of foxd3 and sox9. Increased expression of Zmym4 (C2) primarily increased foxd3 expression, and caused broader sox9 expression in some embryos (∼35%; C2) and reduced expression in others (∼41%; D2). Bar graphs are as in (A). (D) In the preplacodal ectoderm, knockdown of Zmym4 (D1) primarily reduced the expression of six1, irx1, sox9; in contrast, nearly equal numbers of embryos showed no change, expanded or reduced expression of sox11. Increased expression of Zmym4 (D2) showed a minor decrease in six1, whereas for sox11, irx1 and sox9 some embryos showed broader expression while others showed reduced expression. In the D2 embryo images, PPE expression of six1 on mRNA-injected side is slightly reduced compared to control, sox11 is reduced and irx1 is reduced in the anterior placode (arrows). In D2, sox9 is reduced in the otic placode on the injected side (red bar) compared to control (black bar); in C2, sox9 is larger in the otic placode on the injected side (red bar) compared to control (black bar). Bar graphs are as in (A). All embryo images are anterior views with dorsal to the top. np, neural plate. Black scale bars in top right corners = 300 μm.

