FIGURE 4.
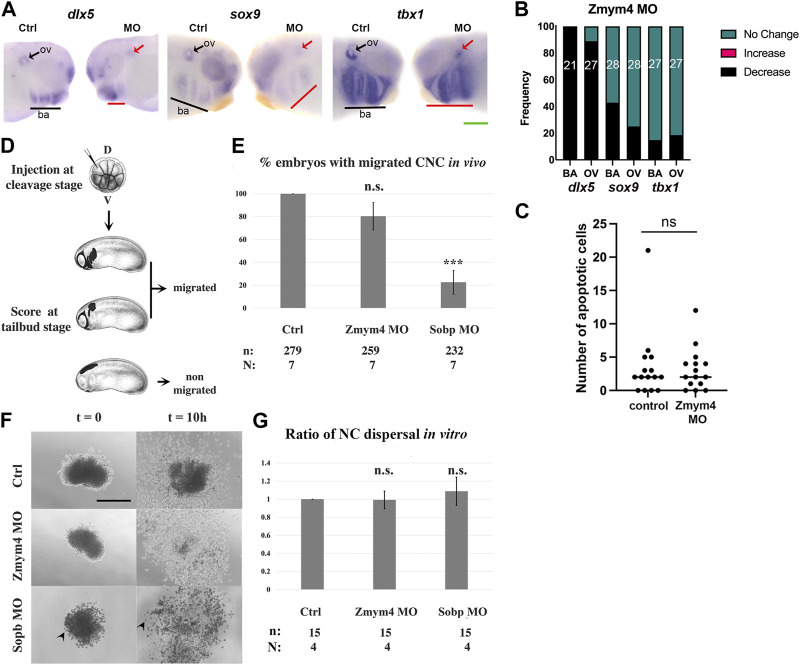
Loss of Zmym4 caused reduced otic vesicle and branchial arch gene expression. (A) Knockdown of Zmym4 reduced the expression dlx5, sox9, and tbx1 in larval otic vesicles (ov, arrows) and branchial arches (ba, underlined) on the MO-injected side compared to the control (Ctrl) side of the same embryo. Green scale bar in lower right corner indicates 200 μm. (B) The percentages of embryos that showed “no change” (green), “increased” (pink), or “decreased” (black) expression on the MO-injected side compared to the control side of the same embryo; the number of embryos examined for each gene is indicated within the bar. Zmym4 knockdown reduced the OV and BA expression of dlx5 in nearly every embryo, whereas it reduced sox9 or tbx1 expression only in small percentages of embryos. (C) Scatter plot of the number of apoptotic cells counted on the control and MO-injected sides of Zmym4 morphant larvae (n = 15). There was no significant difference (ns = p > 0.05) in the number of apoptotic cells after loss of Zmym4. (D) Blastomeres on the dorsal (D) animal side of cleavage stage embryos were microinjected with mbGFP mRNA ± Zmym4 MOs or Sobp MOs. At tailbud stages, embryos were scored as “migrated” if some fluorescently labeled NC entered a migratory pathway and as “non-migrated” if none of them entered any pathway. Embryo images downloaded from Xenbase (https://www.xenbase.org/xenbase/zahn.do). (E) The percentage of embryos with migrated NC cells in the assay shown in (D) n = the number of embryos analyzed; N = the number of independent trials. n. s. = not significant compared to controls. ***, p < 0.001, Student’s t-test (F) DIC images of typical cranial NC explants when they first adhered to the substrate (t = 0) and 10 h later (t = 10h). Arrowheads indicate Sobp morphant cells that are rounded rather than flattened on the FN substrate. Scale bar = 200 μm. (G) The ratio of the area the NC covered between the start and end of the culture period (end/beginning) (NC dispersal). n. s. = not significant compared to controls (p > 0.05, Student’s t-test). n = the number of embryos analyzed; N = the number of independent trials.

