Figure 2.
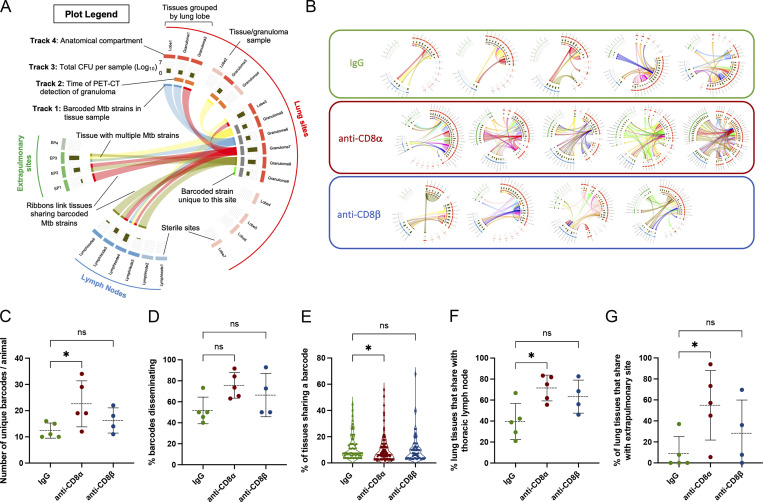
CD8α depletion leads to the dissemination of barcoded Mtb clones across anatomical sites. (A) Circos plot summarizing barcoded Mtb strains shared between infected tissues in lungs (red), thoracic lymph nodes (blue), and at extrapulmonary sites (green). RUL, right upper lobe; RML, right middle lobe; RLL, right lower lobe; LUL, left upper lobe; LML, left middle lobe; LLL, left lower lobe; Acc, accessory lobe. Each color represents a unique barcode sequence and barcodes shared across tissues are linked by a ribbon (Track 1). Additional tracks include the time of lung lesion detection by PET-CT (track 2) at 3 wk (gray) or 6 wk after infection (orange) and bacterial burden in each tissue at necropsy (track 3). (B) Barcode plots from each animal; one animal in the anti-CD8β group failed sequencing and is not included in the analysis. (C) The number of total unique barcode sequences found across all tissues in each animal was quantified. (D) The percent of unique barcoded Mtb strains in each animal that are shared at two or more anatomical sites was quantified. (E) The total percentage of tissues sharing a given barcode was quantified for each group, yielding the following number of barcodes plotted in each treatment group: IgG control, n = 62; CD8α depletion, n = 113; CD8β depletion, n = 65. (F and G) The percent of lung tissues sharing a barcoded Mtb strain with any (F) thoracic lymph node site or (G) extrapoulmonary site was determined for each animal as a measure of dissemination. For data in B–E, the number of animals were as follows: IgG control, n = 5; CD8β depletion, n = 4; CD8α depletion, n = 5. Statistical analysis (C–G): Kruskal–Wallis with Dunn’s multiple comparisons. * P < 0.05, ns P > 0.05.

