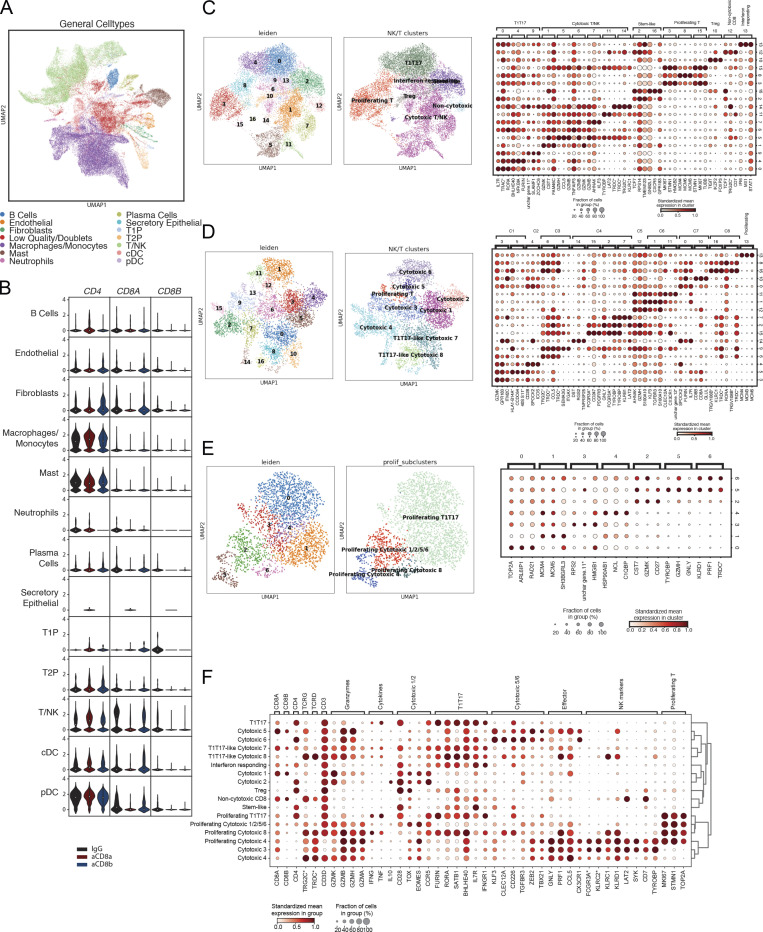
Figure S4.
scRNAseq quality control and subclustering plots. (A) UMAP visualization of major cell types and doublets cells pre-filtering. Each point is a cell. (B) Violin plot of per-cell expression of major lineage markers CD4, CD8A, CD8B (columns) in each major cell type (rows) split by depletion condition (violin plot colors). (C) Leiden subclustering on NK/T cells yielded 17 clusters, which were merged into seven subtypes based on shared marker genes. (D) Leiden subclustering on cytotoxic NK/T cells yielded 17 clusters, which were merged into nine subsets based on shared marker genes. (E) Leiden subclustering on Proliferating NK/T cells yielded seven clusters, which were merged into four proliferating subsets based on shared marker genes. Proliferating NK/T subset names were assigned based on shared marker genes with other NK/T cell subsets (C). (F) Dotplot showing expression of marker and lineage genes on all NK/T subtypes.

