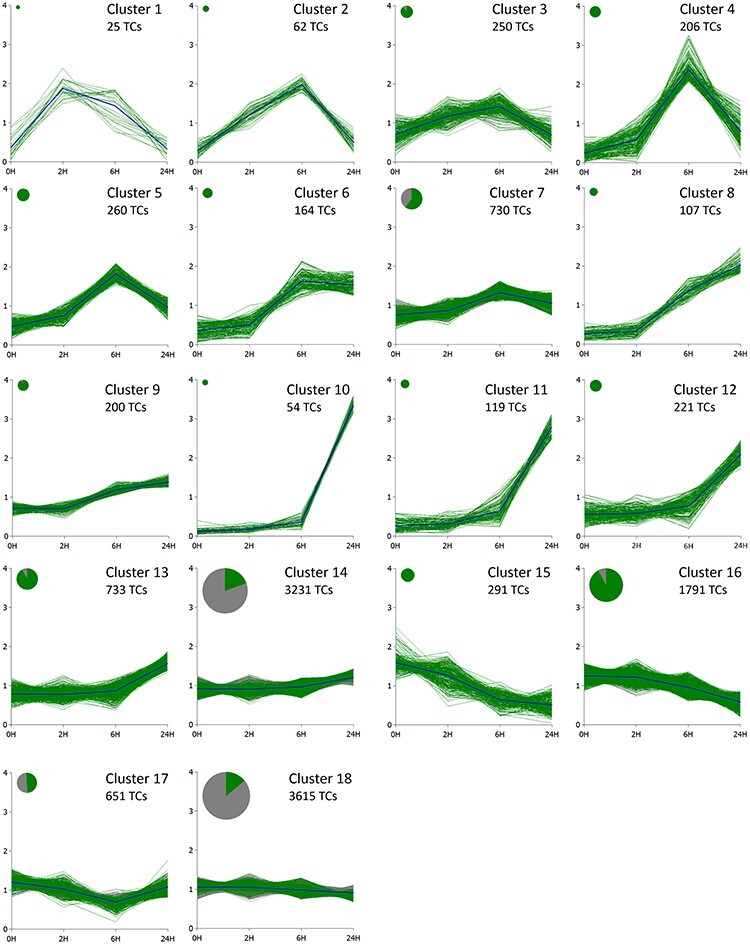
Fig. 2.

Transcripts from UV-C treatment data were grouped by the Bayesian hierarchical clustering algorithm SplineCluster (Heard et al. 2006). All TCs that obtained at least eight CPM in at least four libraries are shown. The transcripts that have statistically significant (FDR < 0.05) differences in expression levels compared to the control are shown in color. The area of the disc is proportional to the number of TCs in the cluster. 0H, control; 2H, 2 h; 6H, 6 h and 24H, 24 h.
