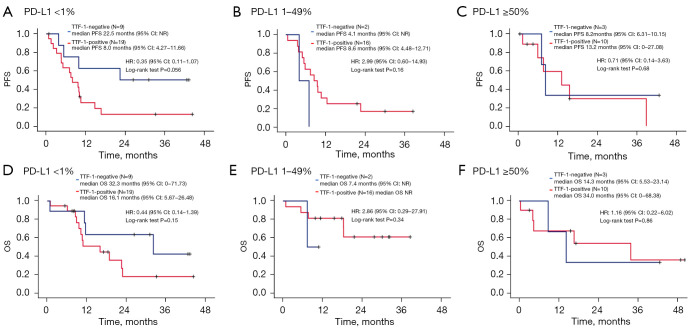
Figure 6.
Kaplan-Meier curves in patients treated with ICI plus chemotherapy according to TTF-1 and PD-L1 expression status. (A) PFS in PD-L1 <1%; (B) PFS in PD-L1 1–49%; (C) PFS in PD-L1 ≥50%; (D) OS in PD-L1 <1%; (E) OS in PD-L1 1–49%; (F) OS in PD-L1 ≥50%. PD-L1, programmed death-ligand 1; TTF-1, thyroid transcription factor-1; PFS, progression-free survival; CI, confidence interval; NR, not reached; HR, hazard ratio; OS, overall survival; ICI, immune checkpoint inhibitor.

