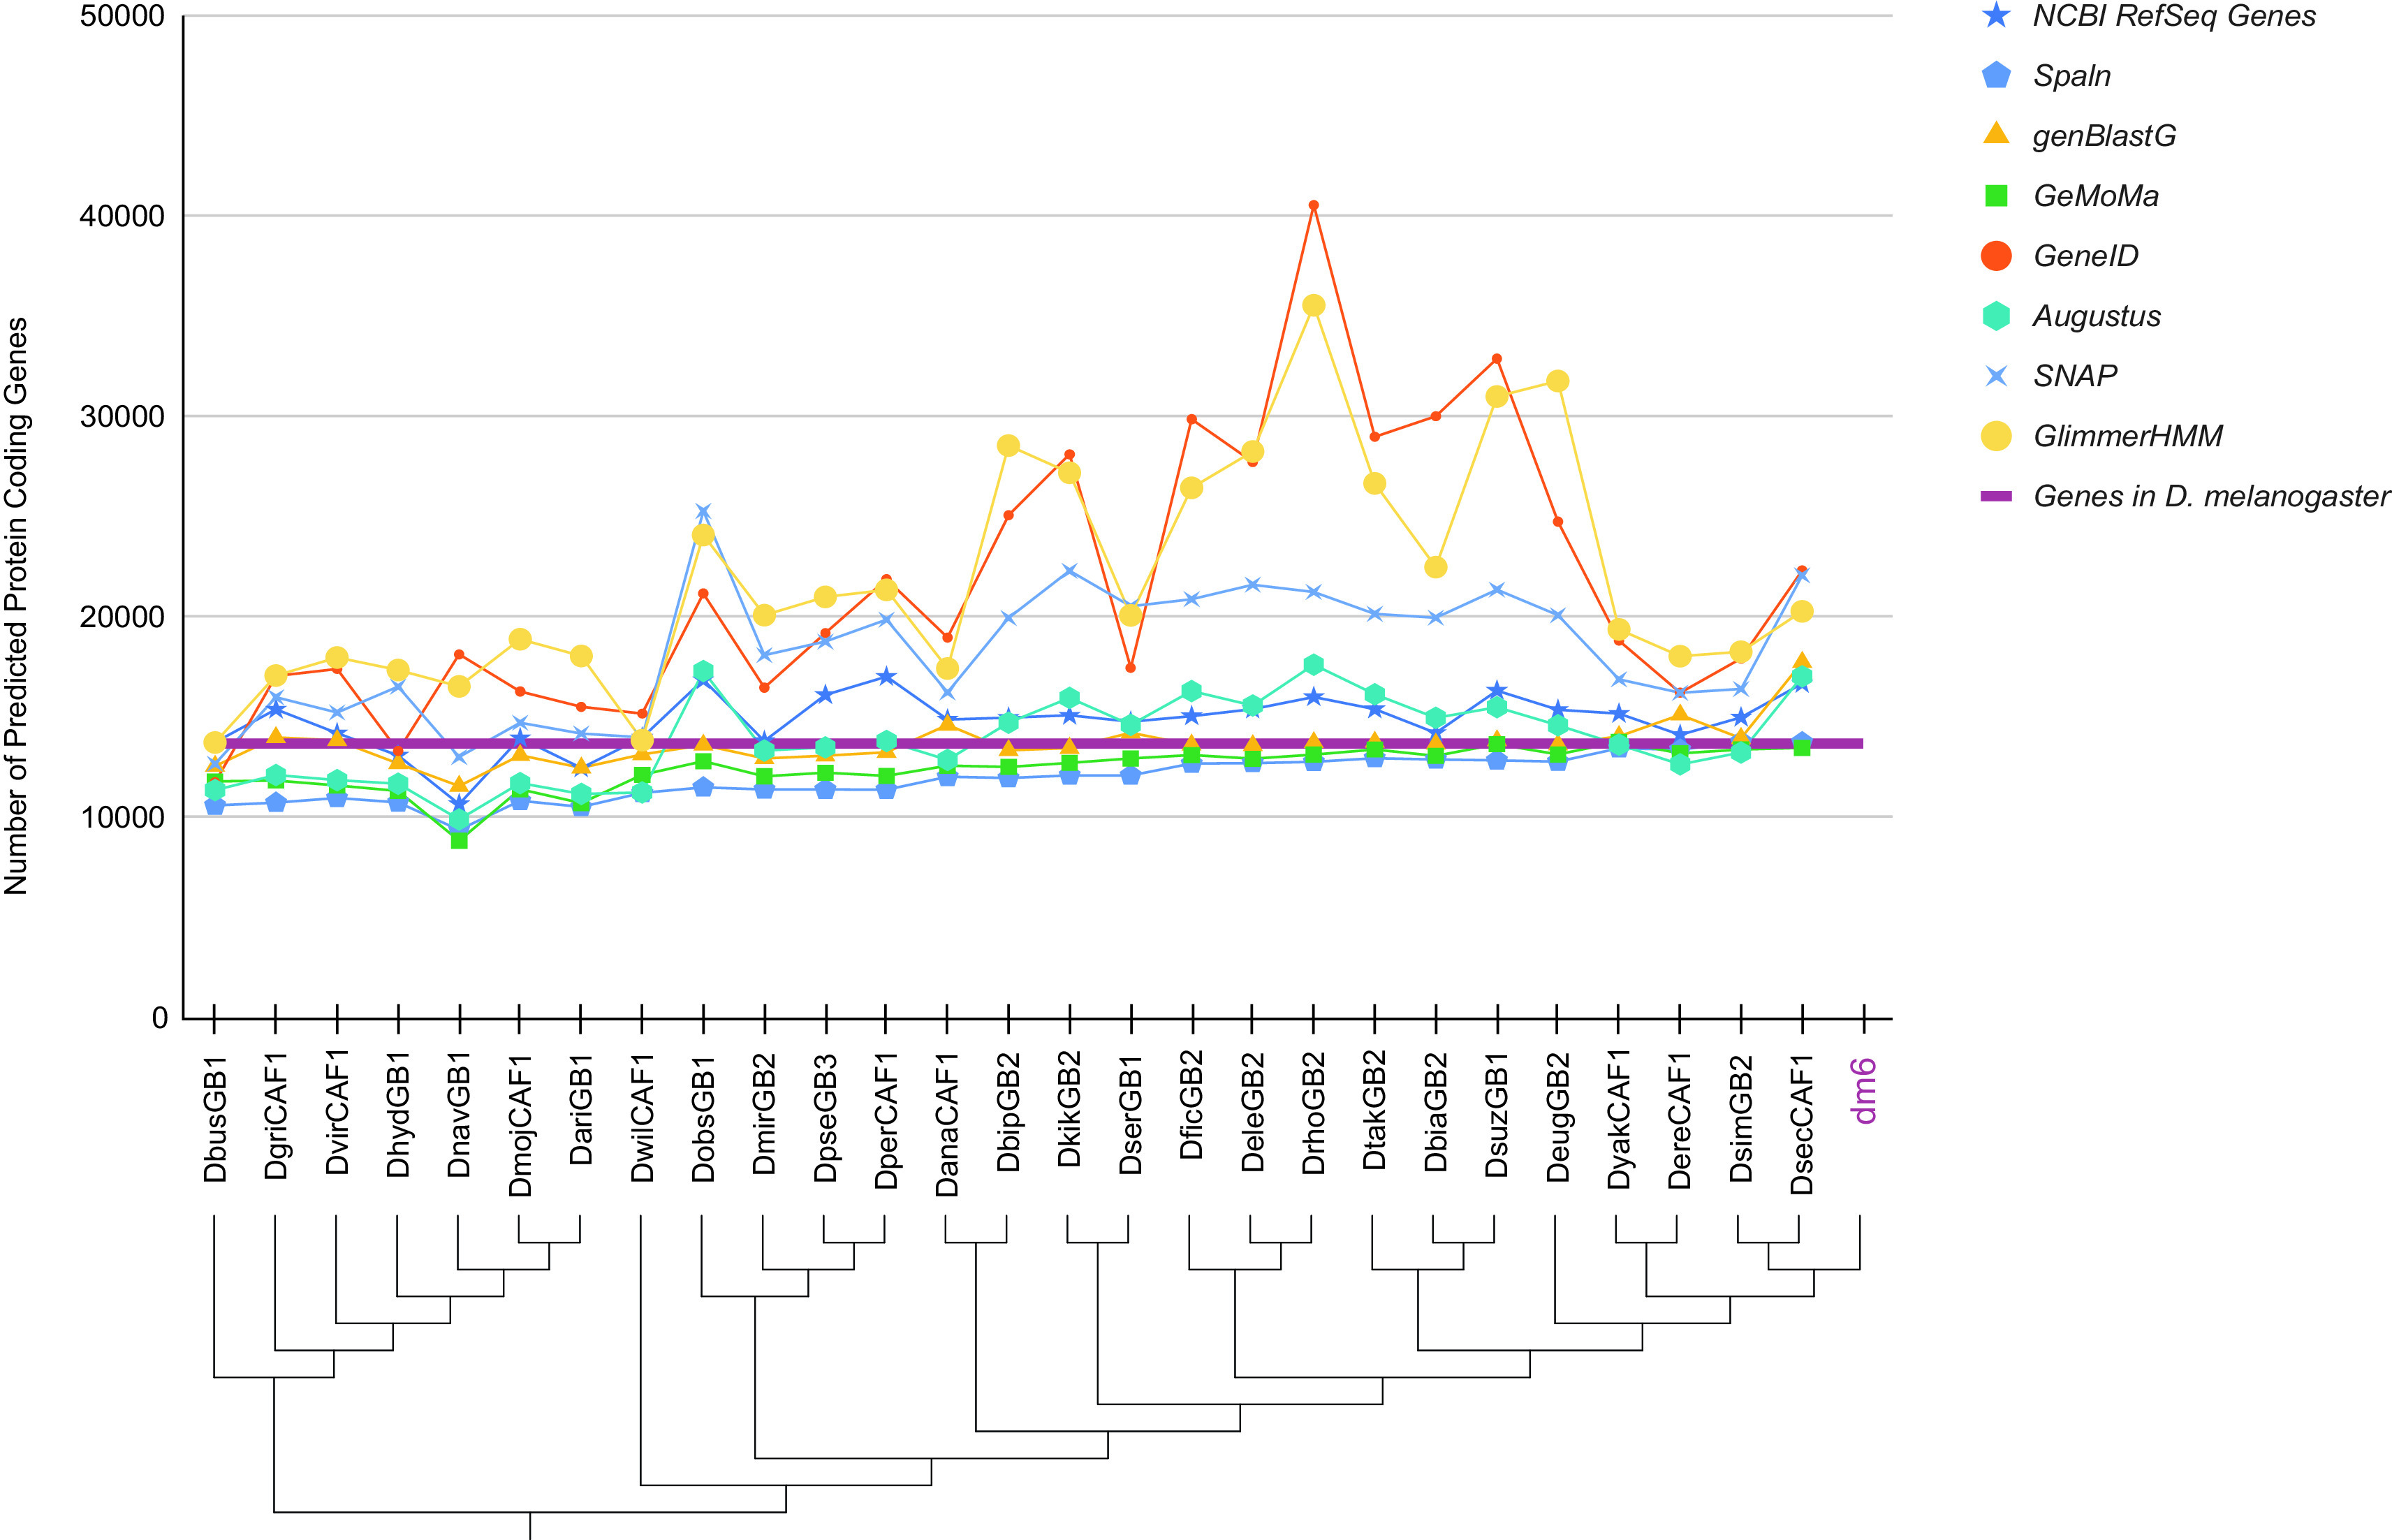
Figure 1. Number of protein-coding genes predicted by different gene predictors for the 27 Drosophila species analyzed for the Pathways Project.

The number of predicted genes can show large variations across algorithms (algorithm information in extended data 4 ) and species, particularly for gene predictors using sequence similarity to genes in a reference species as their primary source of evidence. Some algorithms consistently either predict more (e.g., genBlastG/GeneID) or less (e.g., GeMoMa/Augustus) genes than the number of D. melanogaster genes as curated by FlyBase (purple line). Note that some algorithms (e.g., genBlastG, Spaln) only provide predictions at the transcript level, and the number of protein-coding genes were inferred based on the gene and transcript symbols in D. melanogaster. For example, the genBlastG prediction ey-PA-R1-1-A1 is assigned as the putative ortholog of the D. melanogaster ey gene. The genome assemblies indicated in the cladogram 5 , 6 correspond to those listed in the “GEP Assembly Identifier” column of Table 1.
