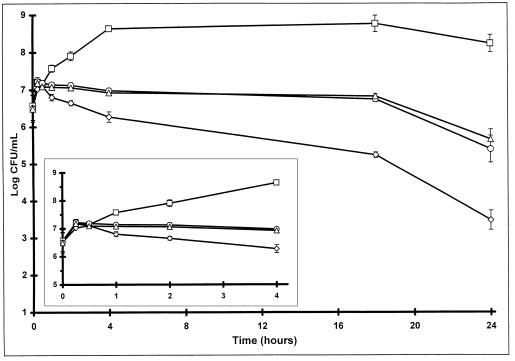
FIG. 2.
A timed-killing curve at four times the MIC demonstrates that the curve for the combination of drugs (▵) follows the curve for clindamycin alone (○). This pattern is consistent at all concentrations greater than one-half the MIC. The combination still results in a >2-log10-unit advantage over the unchecked growth of the control (□). The inset displays earlier time points which produce a pattern consistent with the overall curve. ◊, penicillin.

