Figure 5.

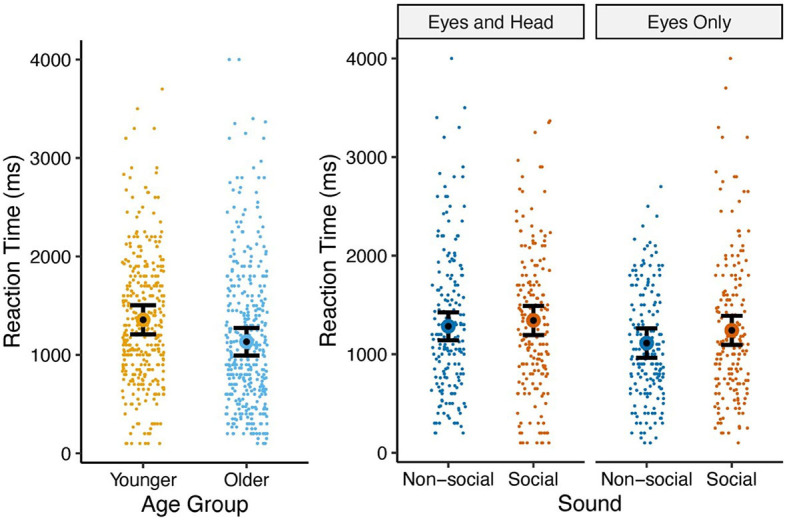
Means and standard errors of proportion of reaction times by age group (left) and gaze type × sound (right). The reaction times represented in this graph were only those trials in which the participant achieved a hit.

Means and standard errors of proportion of reaction times by age group (left) and gaze type × sound (right). The reaction times represented in this graph were only those trials in which the participant achieved a hit.