
Figure 5.
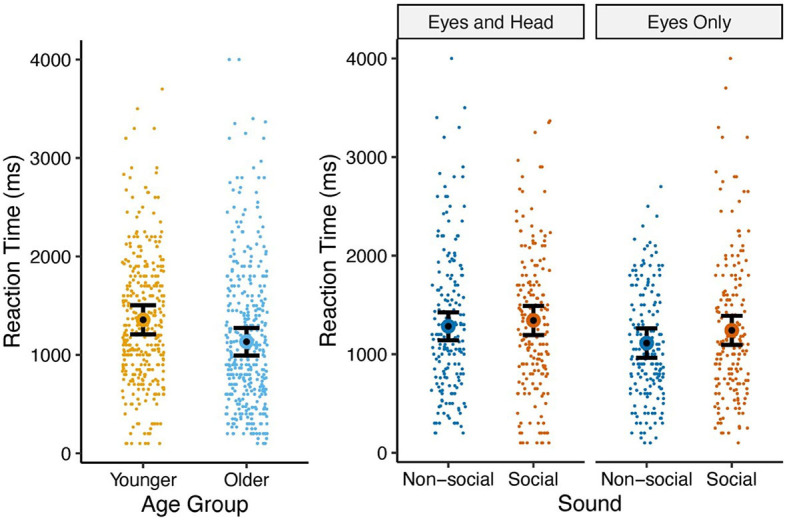
Means and standard errors of proportion of reaction times by age group (left) and gaze type × sound (right). The reaction times represented in this graph were only those trials in which the participant achieved a hit.
Official websites use .gov
A
.gov website belongs to an official
government organization in the United States.
Secure .gov websites use HTTPS
A lock (
) or https:// means you've safely
connected to the .gov website. Share sensitive
information only on official, secure websites.
Means and standard errors of proportion of reaction times by age group (left) and gaze type × sound (right). The reaction times represented in this graph were only those trials in which the participant achieved a hit.