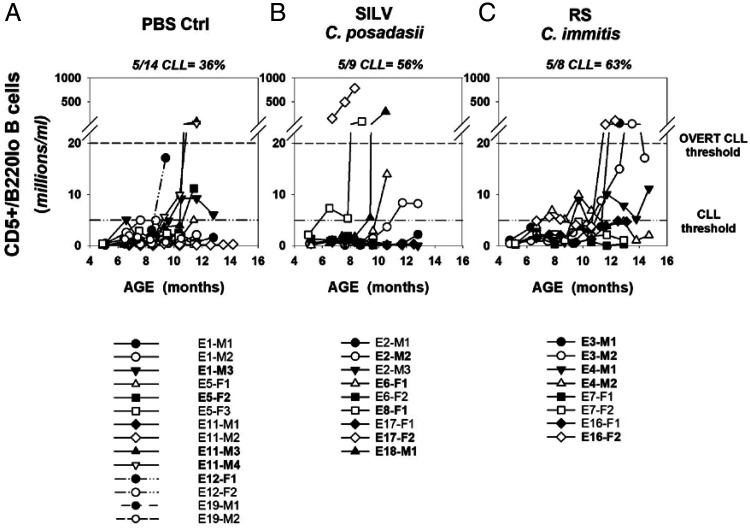
FIGURE 3.
Time course for B-CLL emergence within PBS- and Coccidioides-exposed TCL1-Tg mice.
(A–C) Shown are blood frequencies of B cells with the leukemic phenotype (CD5+/B220low) over the lifespan of individual mice chronically exposed to (A) PBS, (B) SILV, or (C) RS. The lower reference line within each graph represents the threshold frequency for B-CLL diagnosis (5 million/ml; see Materials and Methods for added criteria). The upper reference line represents the threshold for overt B-CLL diagnosis (20 million CD5+/B220low B cells/ml). The legend below each graph supplies mouse identification codes; those in bold achieved a B-CLL diagnosis.

