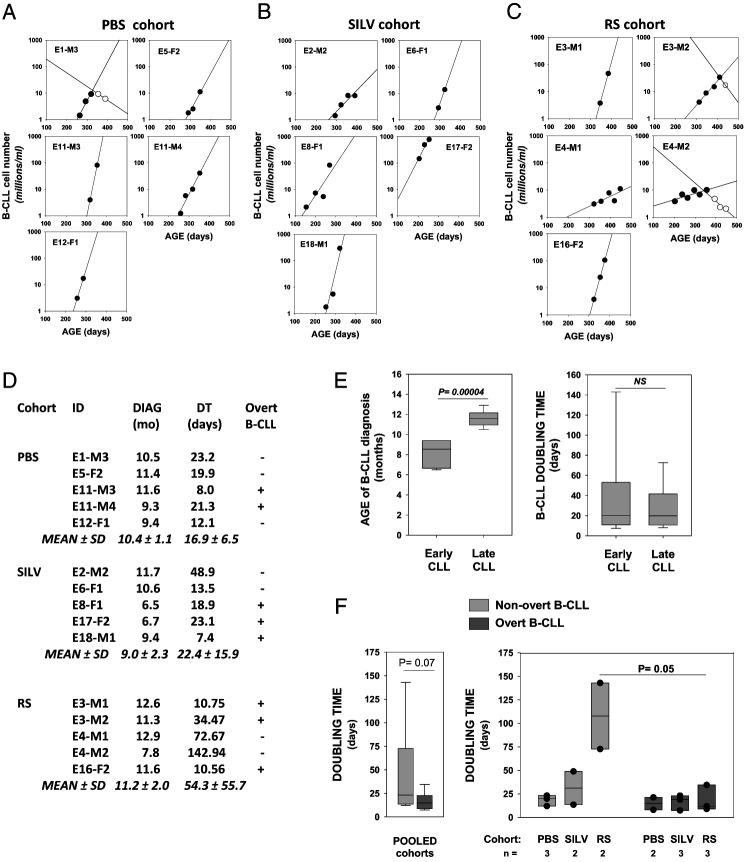
FIGURE 5.
Doubling time determinations for B-CLL populations in control and Coccidioides-exposed mice.
(A–C) Linear regression plots showing frequency of CD5+/B220low B cells (log) versus age of mice diagnosed with B-CLL. (A) PBS. (B) SILV. (C) (RS). Lines with filled symbols show the progressive increase in B-CLL numbers over time. The frequencies of CD5+/B220low cells that qualify as preleukemic monoclonal B cell lymphocytosis (MBL = 0.5–5 million/ml) were included in these plots when the latter supplied added confidence in the linear growth curve. Contraction of the leukemic population was seen in certain mice (E1-M3 in PBS cohort; E3-M2 and E4-M2 in RS cohort). Leukemic cell counts during contraction are shown by open symbols; these were not used to compute initial B-CLL doubling time (DT). (D) Age of diagnosis (months), DT values (days), and overt status of each B-CLL within the PBS, SILV, and RS cohorts. Calculation of DT was achieved with an online DT calculator based on exponential regression (http://www.doubling-time.com/compute). (E) Pooled B-CLLs were categorized as early CLL (n = 6; range, 6.5–9.4 mo) or late CLL (n = 9; range, 10.5–12.9 mo) based on age at diagnosis. By boxplot analysis, the two groups were compared for statistically significant differences in (left) age of B-CLL diagnosis (p = 0.00004 by a two-sided, unpaired t test) and (right) B-CLL DT (not significant). (F) Left, Boxplot analysis for DT in total overt versus total nonovert B-CLL populations (p = 0.070 by nonparametric Mann–Whitney rank-sum test). Boxplots for B-CLL DTs in nonovert (light gray bars) versus overt B-CLL (dark gray bars) of each experimental cohort (overlaid filled symbols represent individual mouse values). Median DT for overt B-CLL was consistently low in all cohorts (no statistically significant difference by Kruskal–Wallis one-way ANOVA on ranks). Greater intercohort diversity in DT was seen in nonovert B-CLL, without reaching statistical significance. Nonetheless, within the RS cohort, DT values for nonovert and overt B-CLL were significantly different (p = 0.025 by a one-sided and p = 0.05 by a two-sided, unpaired t test).

