FIGURE 6.
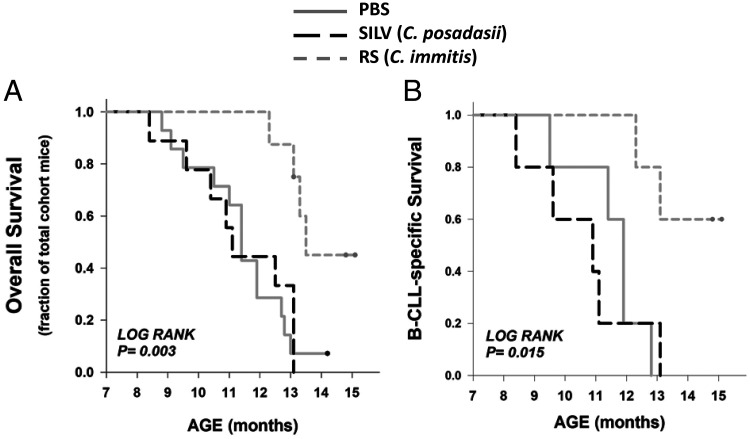
Overall and disease-specific survival times in control and Coccidioides-exposed TCL1-Tg mice.
(A) Kaplan–Meier incidence curves for overall survival (PBS cohort, solid gray; SILV, dashed black; RS, short dash gray). Log rank analysis showed a statistically significant difference within the set of three cohorts (p = 0.003). Statistical significance for all pairwise comparisons is as follows (Holm–Sidak test): PBS versus RS (p = 0.004), SILV versus RS (p = 0.004), and PBS versus SILV (p = 0.717). (B) Kaplan-Meier incidence curves for disease-specific survival (all mice in this analysis developed B-CLL during the 14-mo course of this study). Log rank analysis showed a statistically significant difference within the set of three cohorts (p = 0.015; Holm–Sidak test for pairwise comparisons): PBS versus RS (p = 0.02), SILV versus RS (p = 0.03), and PBS versus SILV (p = 0.18).

