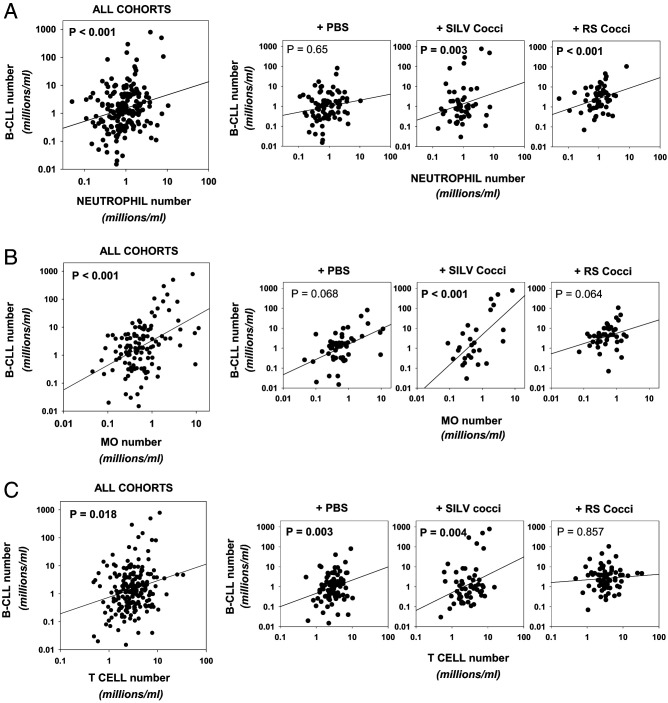
FIGURE 7.
CD5+/B220low (preleukemic and leukemic) cell levels in blood are linked to the frequency of other blood leukocyte populations in a cohort-specific manner.
(A–C) Frequency of CD5+/B220low B cells detected in individual mice at any one blood sampling was plotted against the respective frequency of either (A) neutrophils, (B) monocytes, or (C) T cells. Dot plots and accompanying linear regression lines are shown for pooled mice and mice of each experimental cohort. Values represent data from sequential monthly blood analyses, beginning at 5–6 mo to survival endpoint. In the case of monocytes, fewer mice of each cohort were measured at 5-6 mo. The p values for each linear regression analysis are shown, with those reaching statistical significance (p < 0.05) in bold.

