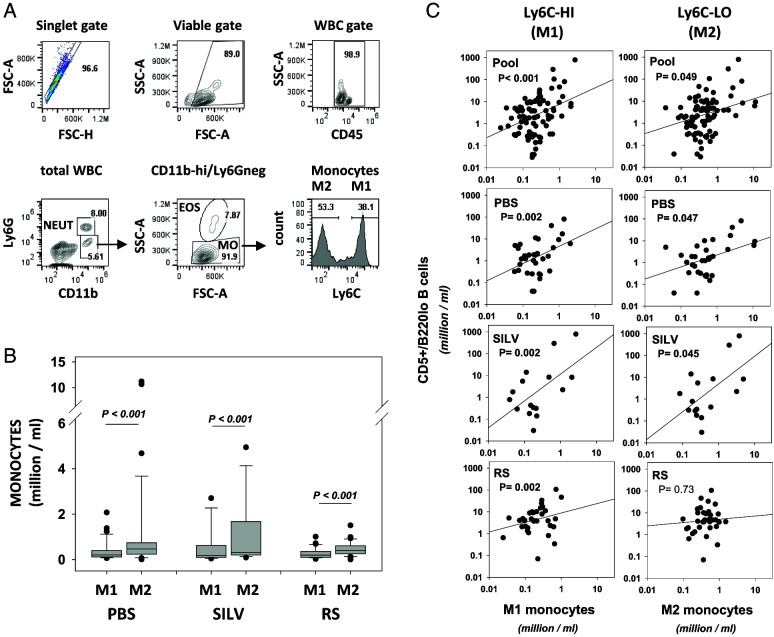
FIGURE 8.
Circulating levels of CD5+/B220low B cells are significantly correlated with the frequency of inflammatory (M1) and anti-inflammatory (M2) monocyte subsets in a cohort-specific manner.
(A) Gating strategy for segregating classical, inflammatory (M1) monocytes and nonclassical, anti-inflammatory (patrolling) (M2) monocytes. M1 cells represent monocytes (CD45+/Ly6G−/CD11bhigh/SSClow) that are gated as Ly6Chigh. M2 cells represent monocytes gated as Ly6C−. Note that monocytes bearing intermediate levels of Ly6C, thought to represent transitional monocytes (64, 65), are not considered. (B) Boxplots showing M1 and M2 cell frequencies in pooled monthly bleeds from control TCL1-Tg mice and similar blood samples from SILV-treated and RS-treated cohorts (PBS cohort, n = 13 mice represented with 34 samplings during 6–13 mo; SILV cohort, n = 7 mice, with 16 samplings during 7–12 mo; RS cohort, n = 8 mice, with 35 samplings during 7–14 mo). Note that in this plot closed symbols represent outliers from the boxplot analysis. Comparison of M1 levels (or M2 levels) between the three cohorts by Kruskal–Wallis one-way ANOVA on ranks showed no statistically significant intercohort differences. However, within each cohort the frequency of M2 cells was significantly greater than the corresponding frequency of M1 cells (p < 0.001 by paired, two-sided t test). See Supplemental Fig. 3 for comparisons to normal aged C57BL/6 mice. (C) Frequency of CD5+B220low B cells is plotted against frequency of M1 cells (left column) or M2 cells (right column). The p values from each linear regression analysis are shown, with those reaching statistical significance (p < 0.05) shown in bold. SSC, side scatter.

