
Fig. 1 |. BA.2 and BA.1 show similar infectivity and pathogenicity in BALB/c mice.
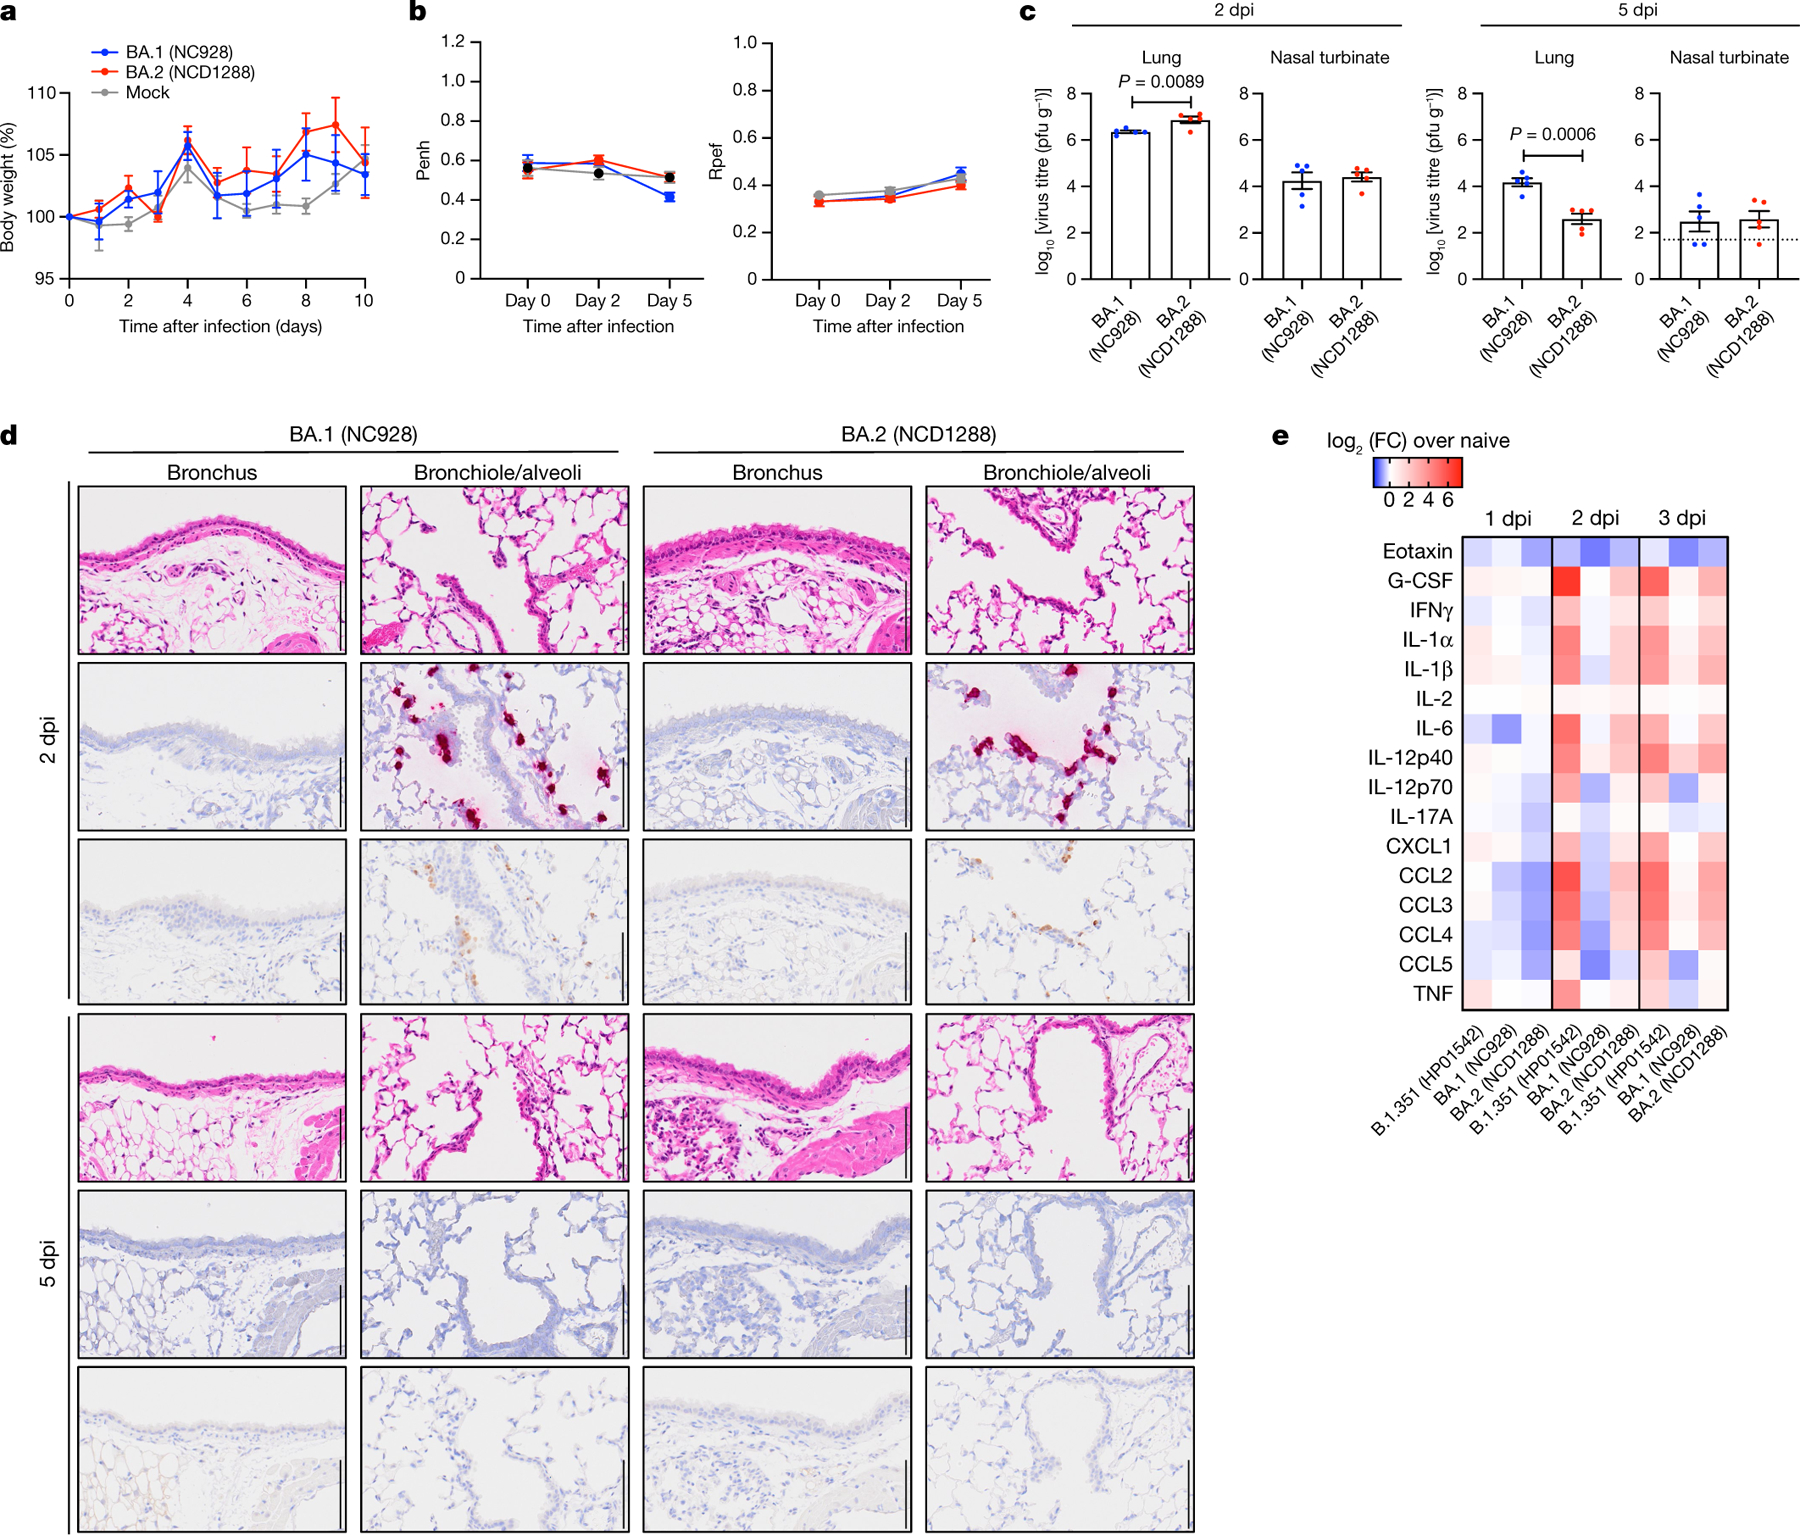
a–c, Mice were inoculated intranasally with 105 PFU BA.1 (NC928), BA.2 (NCD1288) or PBS (mock). a, Body weights of virus-infected (n = 5) and mock-infected (n = 5) mice were monitored daily for 10 days after viral infection. Data are mean percentage ± s.e.m. of the starting weight. b, Pulmonary function analyses in virus-infected (n = 5) and mock-infected (n = 5) mice. Penh and Rpef were measured by whole-body plethysmography. Data are mean ± s.e.m. c, Virus replication in infected mice. Mice (n = 5) were euthanized at 2 and 5 dpi for virus titration. Virus titres in the nasal turbinates and lungs were determined by plaque assay. Data are mean ± s.e.m.; points represent data from individual mice. The lower limit of detection is indicated by the horizontal dashed line. Data were analysed with the Mann–Whitney test. d, Histopathological examination of the lungs of infected mice. Three mice per group were infected with 105 PFU BA.1 (NC928) or BA.2 (NCD1288) and euthanized at 2 or 5 dpi for histopathological examination. Representative images of the bronchi, and bronchioles and alveoli of mice infected with BA.1 or BA.2 are shown. Top row, haematoxylin and eosin (H&E) staining. Middle row, in situ hybridization targeting the nucleocapsid gene of SARS-CoV-2. Bottom row, immunohistochemistry using a rabbit polyclonal antibody that detects SARS-CoV-2 nucleocapsid protein. Scale bars, 100 μm. e, Heat map of cytokine and chemokine concentrations in the lungs of mice (n = 4) infected with 105 PFU BA.1 (NC928), BA.2 (NCD1288) or Beta B.1.351 (HP01542) at 1, 2 and 3 dpi (see Extended Data Fig. 1). Data are from one experiment. FC, fold change.