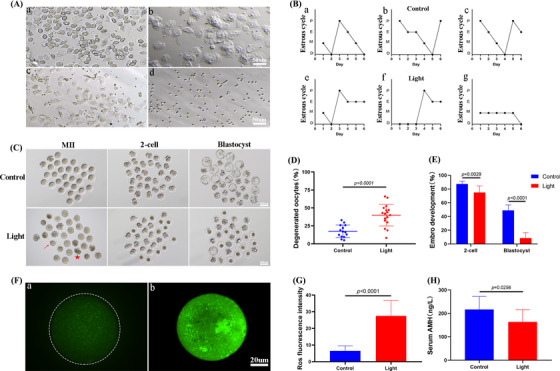
FIGURE 1.

Continuous light exposure leads to the decrease of oocyte quality. (A) [a] Proestrus: vaginal smears showed large round nucleated cells; [b] estrus: vaginal smears mainly showed flat bark‐like irregular keratinized cells; [c] metestrus: vaginal smears began to show small and round white blood cells and keratinized cells; [d] diestrus: vaginal smears mainly showed small and round white blood cells. (B) Representative estrous cycles of two groups. The upper and lower panels represent the control and light groups, respectively. (C) Representative images of the oocytes, two‐cell embryos and blastocyst development in the two groups. (D) Showing degenerated oocyte rates in the two groups. (E) The difference in the two‐cell embryos and blastocyst development were observed in three groups of oocytes. When counting the rate of two‐cell embryos, the denominator was the number of double pronuclear eggs. When counting the rate of blastocyst development, the denominator was the number of two‐cell embryos. (F) Confocal microscopy showing the changes of reactive oxygen species (ROS) production, measured as 2′,7′‐Dichlorodihydrofluorescein diacetate (DCFH) fluorescence. [a], [b] The typical image of the Control and Light groups, respectively. (G) ROS production measured by DCFH fluorescence in the two groups of oocytes. (H) Serum anti‐Mullerian hormone (AMH) concentration.
