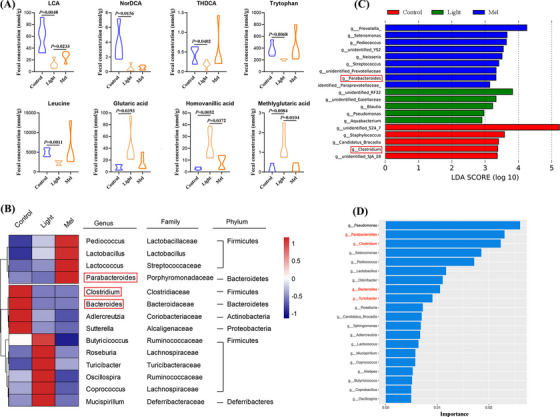
FIGURE 5.

Mice exposed to continuous light suffered gut microbiota dysbiosis. (A) Comparison of the concentrations of lithocholic acid (LCA), NorDCA, THDCA, tryptophan, leucine, glutaric acid, homovanillic acid and methylglutaric acid in the three groups. (B) Heatmap of differential abundance from the light and Mel groups compared with the control group. (C) The LEfSe analysis showing characteristic bacteria in the three groups. (D) Random forests analysis showing 20 important markers of intergroup differences.
