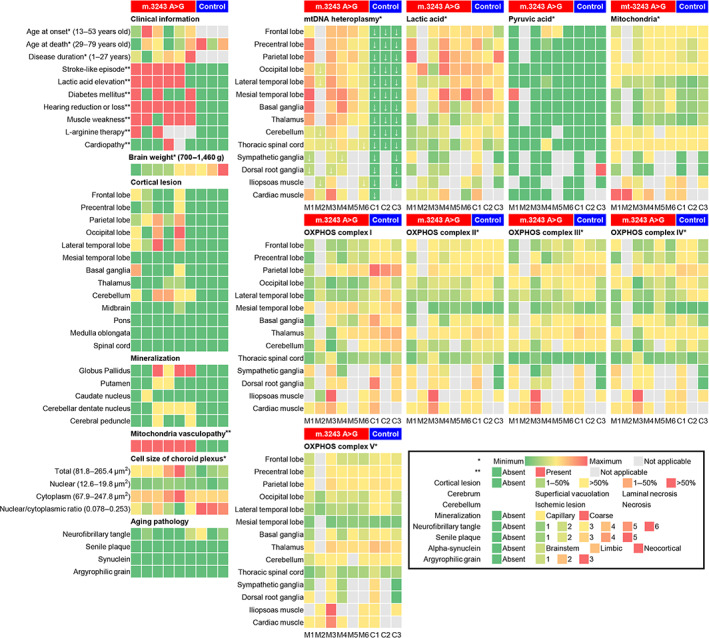
FIGURE 3.

Heatmap visualization in cases with or without the m.3243A>G mutation. Each case was placed in ascending order of brain weight. In the mutant cases, cortical lesions were frequently observed in the lateral temporal, parietal, and occipital lobes, and the mtDNA heteroplasmy was entirely high. White down arrow symbols showed less than 60% of mtDNA heteroplasmy. OXPHOS complex I was decreased in the mutant cases compared to the control cases.
