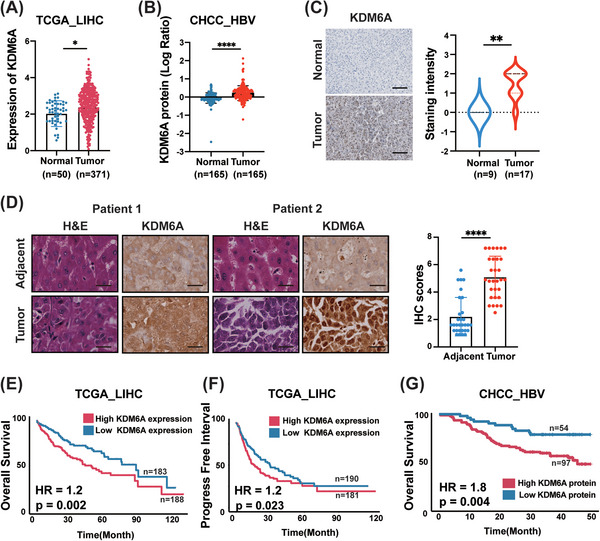
FIGURE 1.

KDM6A is abundantly expressed in tumour tissues and is associated with a poor prognosis. (A) Comparison of the KDM6A mRNA level between HCC (Tumour) and normal tissues (Normal) in TCGA_LIHC dataset. TCGA, The cancer genome atlas; LIHC, liver hepatocellular carcinoma. (B) Comparison of the KDM6A protein level between HCC (Tumour) and normal tissues (Normal) in CHCC_HBV dataset. CHCC_HBV, HBV‐related hepatocellular carcinoma dataset, see Section 2. (C) Staining intensity of the KDM6A protein level between HCC (Tumour) and normal tissues (Normal) in PronteinAtlas (https://www.proteinatlas.org/). Scale bar,100 μm. (D) Staining intensity of the KDM6A protein level between HCC (Tumour) and normal tissues (Normal) in HCC tissue microarray (30 HCC tissues and 30 adjacent normal tissue). Representative images were shown (Patient 1 and Patient 2) and quantification results. The IHC scores were assigned according to the percentage of positive staining cells (0−100%) and the staining intensity (0–8). Scale bar, 25 μm. (E‐F) Kaplan–Meier analysis of overall survival (OS) probability (E) and progression‐free interval probability (F) of KDM6A levels in TCGA_LIHC patients. The statistical significance was assessed using two‐sided log‐rank test. TCGA, The cancer genome atlas; LIHC, liver hepatocellular carcinoma. (G) Kaplan–Meier analysis of OS probability of KDM6A protein levels in CHCC_HBV patients. The statistical significance was assessed using two‐sided log‐rank test. CHCC_HBV, HBV‐related hepatocellular carcinoma dataset, see Section 2. Data represent mean ± SD. p Values were calculated using a student t test unless otherwise stated. *p < .05; **p < .01; ***p < .001; ****p < .0001.
