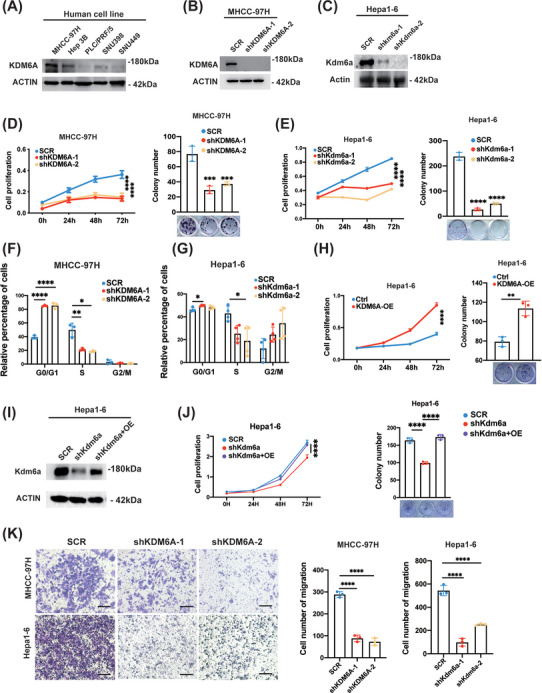
FIGURE 2.

KDM6A knockdown reduces HCC cell proliferation and migration. (A) Western blot analysis of the protein levels of KDM6A in multiple HCC cell lines (MHCC‐97H, Hep 3B, PLC/PRF/5, SNU398 and SNU449). HCC, hepatocellular carcinoma. (B‐C) Western blot analysis of the protein levels of KDM6A after stable knockdown of KDM6A by shRNAs in MHCC‐97H and Hepa1–6 cell lines. (D‐E) CCK8 assays (n = 6) and colony formation assays (n = 3) of MHCC‐97H (D) and Hepa1–6 (E) cells after stable knockdown of KDM6A (n = 6). CCK8, Cell Counting Kit‐8. (F‐G) Cell cycle analysis of MHCC‐97H (n = 3) (F) and Hepa1–6 (n = 4) (G) cells after KDM6A stable knockdown. (H) CCK8 assay (n = 6) and colony formation assay (n = 3) of Hepa1–6 cells after stable overexpression of KDM6A. (I) Validation of KDM6A expression by Western blot in Kdm6a stable knockdown (target 3′UTR region) Hepa1–6 cells after forced Kdm6a overexpression. (J) CCK8 assay (n = 6) and colony formation assay (n = 3) in Kdm6a stable knockdown (target 3′UTR region) Hepa1–6 cells after forced Kdm6a overexpression. (K) Transwell assays of MHCC‐97H and Hepa1–6 cells after stable knockdown of KDM6A by shRNAs. Representative images (left) and quantification results (n = 3) were shown. Scale bar, 25 μm. Data represent mean ± SD. p Values were calculated using a student t test. The significance of multiple group comparisons was analysed by one‐way ANOVA. *p < .05; **p < .01; ***p < .001; ****p < .0001.
