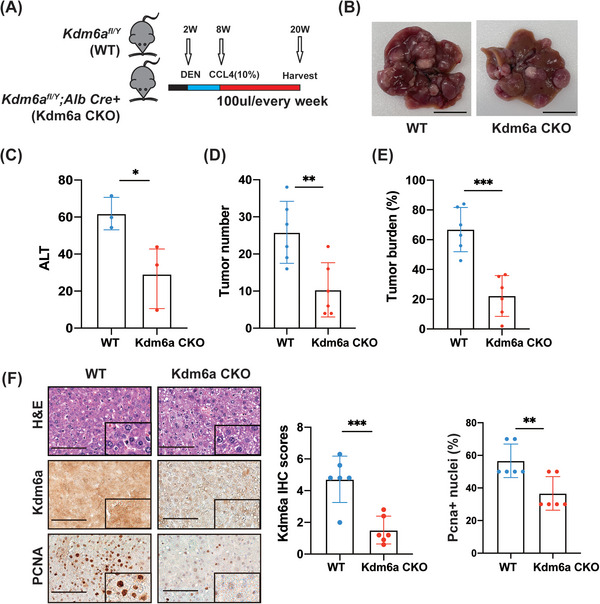
FIGURE 3.

KDM6A promotes HCC tumourigenesis potential. (A) Schematic plot about establishment of mouse liver cancer model. (B) Representative images of HCC (n = 6 per group, WT versus Kdm6a CKO) from the mouse liver cancer models 12 weeks after HCC mouse model established (see Section 2). Scale bar,1 cm. (C) Serum ALT per mouse was measured (n = 3 per group, WT versus Kdm6a CKO). ALT, alanine transaminase. (D) Tumour number per mouse were measured (n = 6 mice per group, WT versus Kdm6a CKO). (E) Tumour burden per mouse liver were measured (n = 6 mice per group, WT versus Kdm6a CKO). Tumour burden = average (tumour area/liver area × 100%). (F) Representative images of IHC and H&E of Kdm6a, PCNA staining and the relative IHC scores (n = 6, WT versus Kdm6a CKO) of PCNA in mouse tumour tissues shown in (B). The IHC scores were assigned according to the percentage of positive staining cells (0−100%) and the staining intensity (0–8). Scale bar, 100 μm. The rectangles within the figure panels signified a magnified image (40×). IHC, immunohistochemistry; H&E, haematoxylin–eosin staining. Data represent mean ± SD. p Values were calculated using a student t test unless otherwise stated. *p < .05; ** p < .01; ***p < .001.
