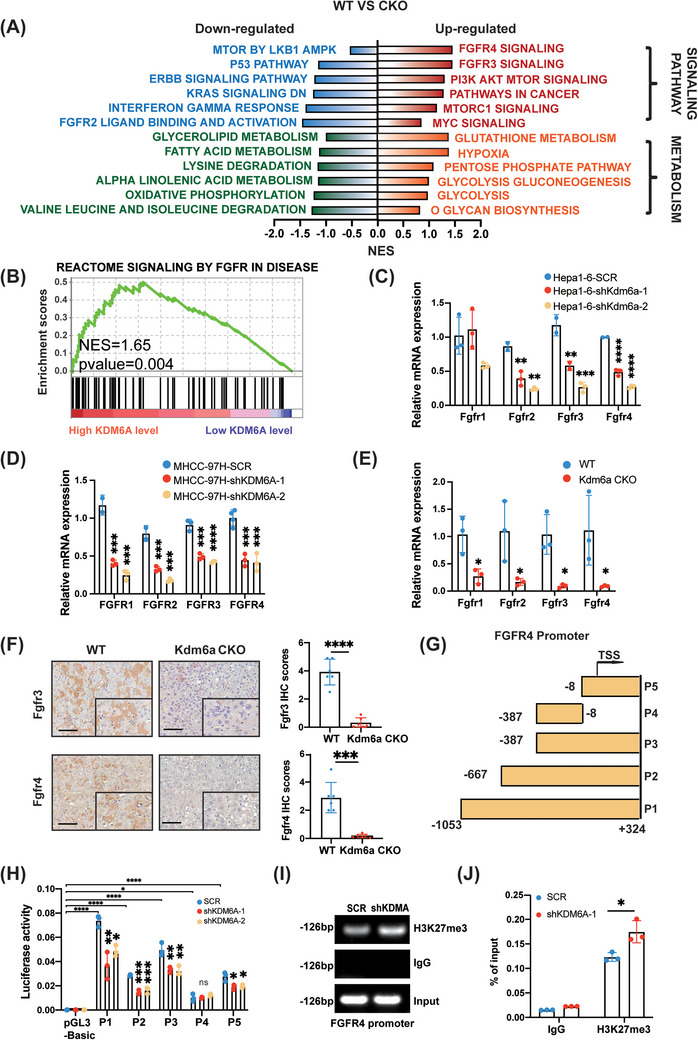
FIGURE 4.

KDM6A regulates FGFR4 transcription to alter HCC metabolism. (A) The results of GSEA analysis in RNA‐sequencing (WT versus Kdm6a CKO, n = 5/5) in HCC tumour tissues. GSEA, Gene Set Enrichment Analysis. (B) The detailed results of enriched pathways related to Signaling By Fgfr in disease in TCGA_LIHC (KDM6A high level versus low, n = 185/184). TCGA, The Cancer Genome Atlas; LIHC, liver hepatocellular carcinoma. (C‐E) Relative mRNA level of FGFRs genes by qPCR in Hepa1–6 (C), MHCC‐97H (D) and mouse HCC tissues (WT versus Kdm6a CKO) (E) after KDM6A knockdown (n = 3). (F) Representative images of IHC and H&E of Fgfr3 and Fgfr4 staining and the relative IHC scores (n = 6) in mouse tumour tissues. The IHC scores were assigned according to the percentage of positive staining cells (0−100%) and the staining intensity (0–8). Scale bar, 100 μm. The rectangles within the figure panels signified a magnified image (40×). IHC, Immunohistochemistry; H&E, haematoxylin–eosin staining. (G‐H) Luciferase activities of corresponding fragments pGL3‐basic and (P1–P5) of FGFR4 promoter were examined by luciferase reporter assay in HET293T cells (n = 3, others see Section 2). (I‐J) ChIP assays above to examine the enrichment in FGFR4 promoter among indicated shKDM6A‐1 cells using antibodies of IgG and H3K27me3 (n = 3). Data represent mean ± SD. p values were calculated using a student t test. The significance of multiple group comparisons was analysed by one‐way ANOVA. ns, no significance; * p < .05; **p < .01; ***p < .001; ****p < .0001.
