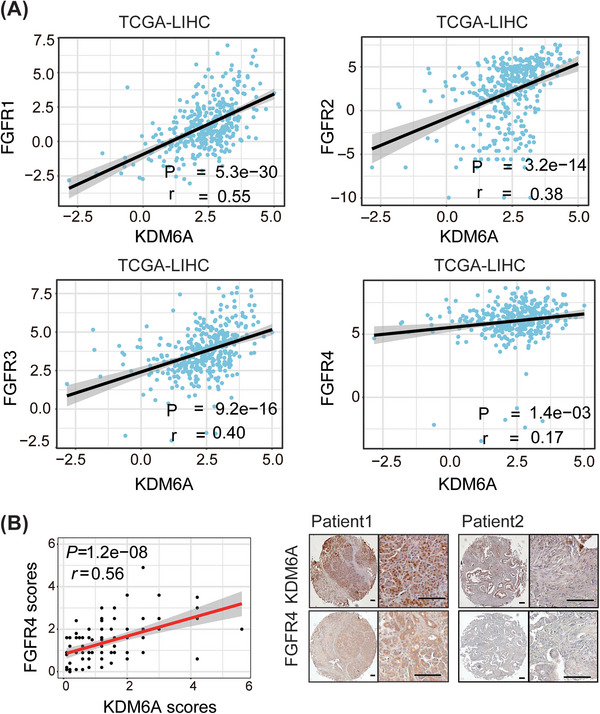
FIGURE 5.

KDM6A expression is positively correlated to FGFR4 expression in clinical samples. (A) Correlation between KDM6A and FGFRs mRNA level in TCGA_LIHC by Spearman's correlation coefficient analysis. TCGA, The Cancer Genome Atlas; LIHC, liver hepatocellular carcinoma. (B) Representative images (right) of IHC of KDM6A and FGFR4 staining in human HCC microarray and the correlation (left) between KDM6A and FGFR4 IHC scores by Spearman's correlation coefficient analysis (n = 90). The IHC scores were assigned according to the percentage of positive staining cells (0−100%) and the staining intensity (0–8). IHC, Immunohistochemistry. Scale bar, 100 μm.
