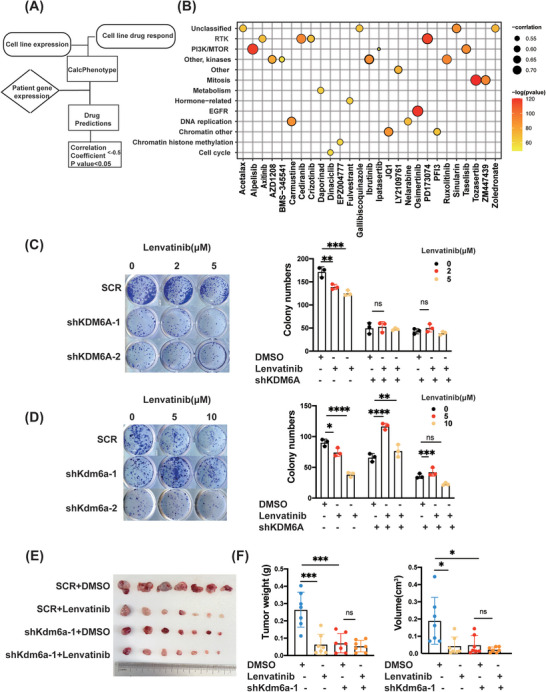
FIGURE 7.

KDM6A knockdown decreases the sensitivity of HCC to lenvatinib treatment. (A) Schematic plot about ‘OncoPredict’ R package use. (B) Correlation between of KDM6A expression and the drug prediction scores (Correlation Coefficient ← .5, p value < .05). Detailed information are in Supporting Information Table S2. (C‐D) Colony formation assays of MHCC‐97H (C) and Hepa1–6 (D) cells in SCR or KDM6A knockdown cells treated with lenvatinib (0–10 μM) or DMSO for 10−14 days (n = 3). (E) Photographs of subcutaneous tumours when they were harvested (n = 7 mice per group). (F) Subcutaneous Hepa1–6 cells tumour weight and tumour volume in the indicated treatment groups (n = 7 mice per group). Data represent mean ± SD. p Values were calculated using a student t test. The significance of multiple group comparisons was analysed by one‐way ANOVA. ns, no significance; *p < .05; **p < .01; ***p < .001.
