Figure 1.
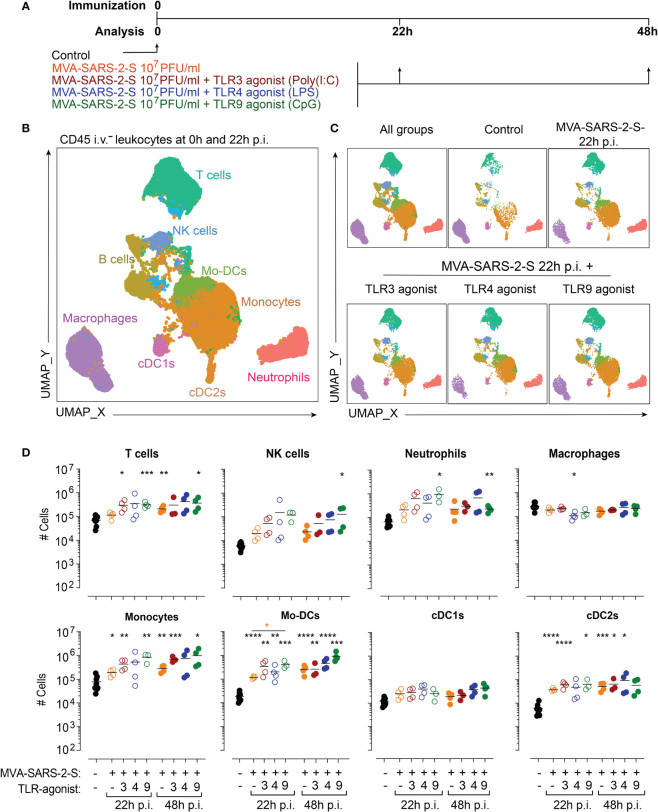
TLR agonists do not exaggerate MVA-SARS-2-S induced acute inflammation in the lungs. (A) Scheme of immunization protocol. (B, C) Leukocyte composition within lung parenchyma presented as a UMAP plot generated from concatenated samples of two representative mice from each experimental group at 24 hours p.i. (two independent experiments with n = 3-4 mice per group). Spectral flow cytometry data are gated as depicted in Supplementary Figure 1A using antibodies listed in Supplementary Table S1 (Panel 1). (D) Absolute cell numbers of T cells, NK cells, neutrophils, macrophages, monocytes, monocyte-derived dendritic cells (Mo-DCs), conventional dendritic cells type 1 (cDC1s) and type 2 (cDC2s). Individual values (symbols) and mean group value (lines) pooled from two experiments with n = 3-4 per group. Statistical analysis was done on log-transformed using Brown-Forsythe ANOVA test followed by Dunnett’s T3 multiple comparisons test. *p < 0.05, **p < 0.01, ***p < 0.001, ****p < 0.0001. Black stars - difference to control group; Orange stars – difference between groups receiving vaccine and vaccine mixed with TLR agonists, as denoted by the line.

