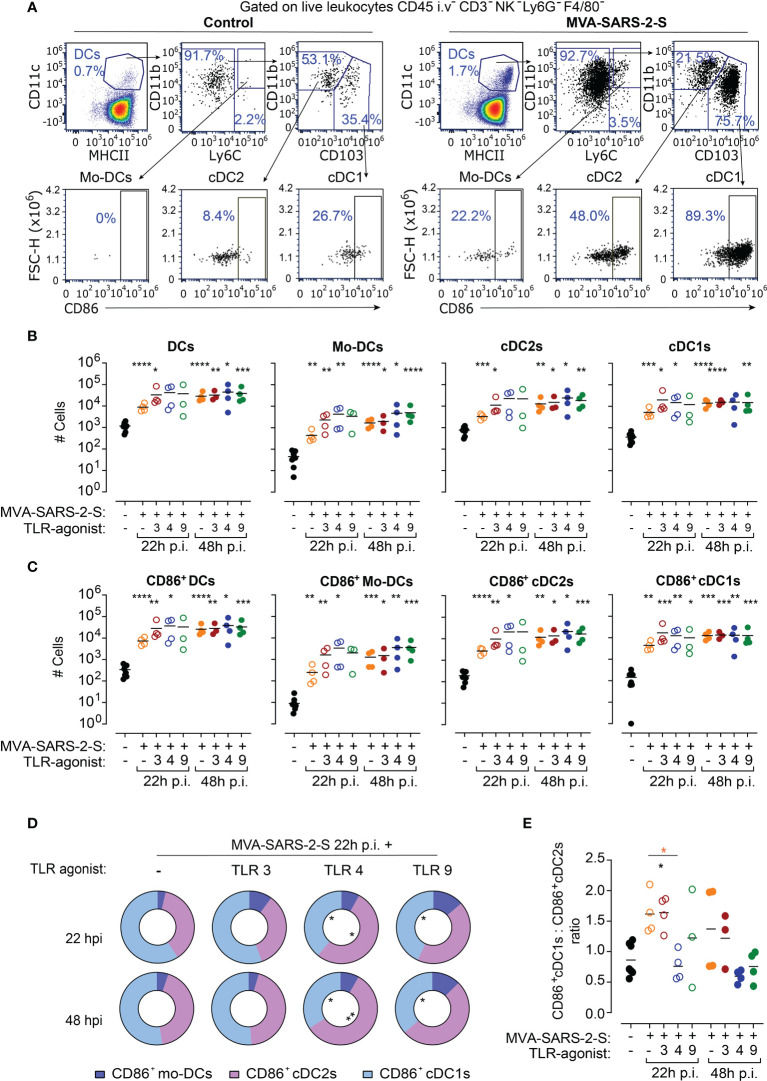
Figure 2.
TLR4 agonists increased proportion of cDC2 cells in bronchial lymph nodes (bLNs) at 24 hours (h) after MVA-SARS-2-S immunization. (A) Representative dot plots identifying absolute and activated (CD86+) DCs and their subpopulations: monocyte-derived dendritic cells (Mo-DCs), conventional dendritic cells type 1 (cDC1s) and type 2 (cDC2s) in bLNs of indicated groups. (B, C) Absolute cell numbers (B) and number of CD86+ (C) total DCs, Mo-DCs, cDC2s, and cDC1s. (D) Relative distribution of CD86+Mo-DCs, CD86+cDC1s, and CD86+cDC2s in indicated groups. (E) Ratio between CD86+cDC1s and CD86+cDC2s across different analyzed groups. (B–E) Pooled data from two experiments with n=3-4 mice per group. (B, C, E) Individual values (symbols) and mean group value (lines). Statistical analysis was done on log-transformed (B, C) or ratios (E) using Brown-Forsythe ANOVA test followed by Dunnett’s T3 multiple comparisons test and Two-way ANOVA (D). *p < 0.05, **p < 0.01, ***p < 0.001, ****p < 0.0001. Black stars - difference to control group; Orange stars – difference between groups receiving vaccine and vaccine mixed with TLR agonists, as denoted by the line.

