Figure 6.
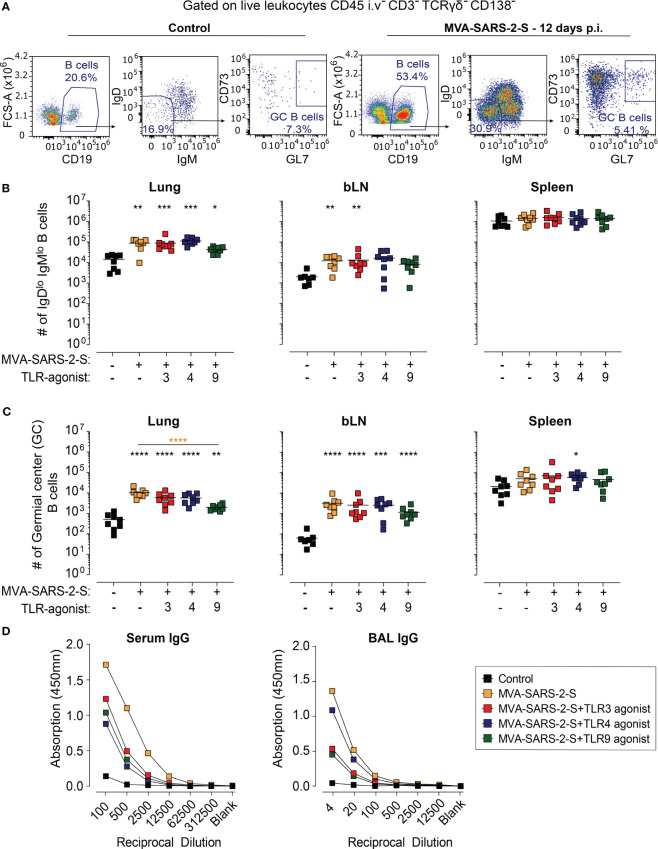
The addition of TLR agonists to MVA-SARS-2-S does not boost humoral response following intranasal vaccination. (A) Representative plots showing percentages of total, isotype-switched (IgDlo IgMlo), and germinal center (GC) B cells in the lungs of indicated groups. (B, C) Absolute cell counts of IgDlo IgMlo B cells (B) and GC B cells (C) in lungs, bronchial lymph nodes (bLNs), and spleens. (D) Spike-specific antibodies in serum and broncho-alveolar lavage fluid (BAL) were quantified using ELISA and presented as mean group OD value. (B–D) Data from four separate experiments were combined, with a total of 8 mice per group. (B, C) Each data point is represented by a symbol, and the mean value for each group is shown with a line. Statistical analysis was performed using Brown-Forsythe ANOVA test, followed by Dunnett’s T3 multiple comparisons test, on logarithmically transformed values. Significance levels are denoted by asterisks: *p < 0.05, **p < 0.01, ***p < 0.001, ****p < 0.0001. Black stars - difference to control group; Orange stars – difference between groups receiving vaccine and vaccine mixed with TLR agonists, as denoted by the line.

