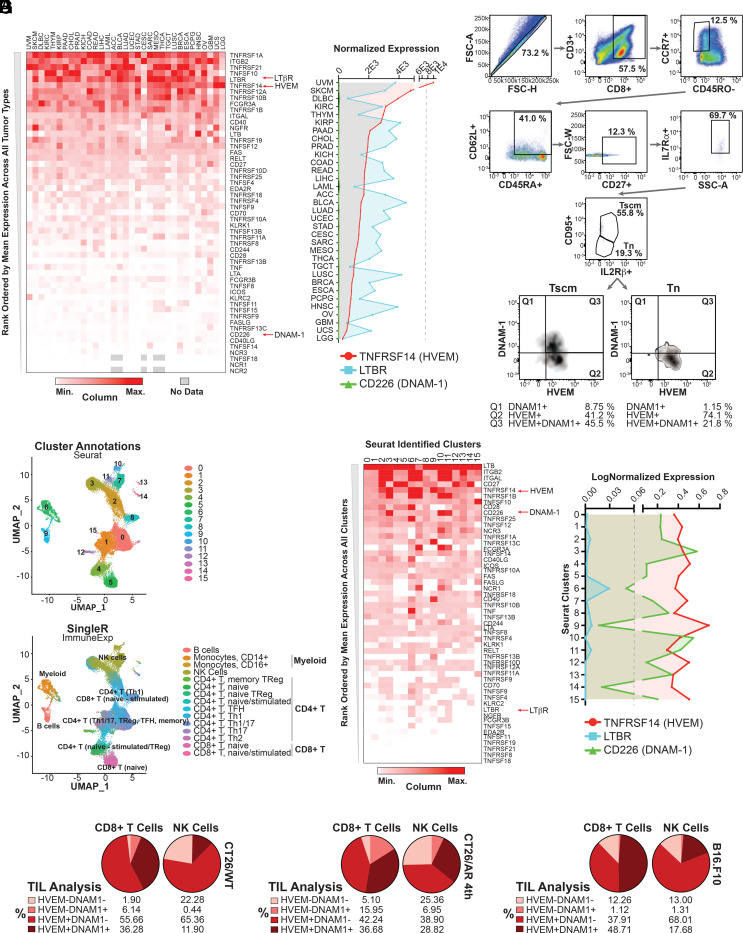
FIGURE 1.
Immune costimulatory receptor expression across various peripheral blood cell subtypes and within human and mouse TILs. (A) Heatmap depicting the relative expression of 53 immune costimulatory genes across TCGA cancers ranked ordered based on high to low mean expression across all tumor types. The intensity of expression is depicted based on the minimum and maximum values in each column. Three genes of interest, that is, TNFRSF14 (HVEM), CD226 (DNAM-1), and LTBR (LTβR), are highlighted. (B) The normalized expression levels of TNFRSF14, CD226, and LTBR across all TCGA tumor types are plotted on the same scale to depict relative mRNA expression of these target genes in relationship to each other. (C) Human naive CD8+ T cells isolated from healthy donor PBMCs using magnetic separation were cultured in AIMV media with CD3/CD28 beads, human recombinant IL-2, and the GSK3β inhibitor TWS119 for 9 d. Following this time course, cells were isolated and assessed by flow cytometry according to a previously identified Ab panel that characterizes naive CD8+ T (Tn) cells and T stem cell memory CD8+ T cells (Tscms). The relative levels of HVEM and DNAM-1 are depicted and quantitated across both Tscms and Tn cells. (D) Human PBMCs cultured in AIMV media for 2 d were isolated and subjected to single-cell RNA sequencing (scRNA-seq). UMAP spatial organization was assessed using Seurat identified clusters (top) and SingleR to plot immune cell subtypes according to ImmuneExp (bottom). (E) Heatmap depicting the relative expression of 53 immune costimulatory genes across Seurat-identified clusters. Genes are ranked ordered based on high to low mean expression across all clusters. The intensity of expression is shown based on the minimum and maximum values in each column. Three genes of interest, that is, TNFRSF14 (HVEM), CD226 (DNAM-1), and LTBR (LTβR), are highlighted. (F) The normalized expression level of TNFRSF14, CD226, and LTBR across Seurat-identified clusters is plotted on the same scale to depict relative mRNA expression of these target genes in relationship to each other. (G) Murine CT26 wild-type colorectal (CT26/WT) tumors, CT26 tumors engineered to develop CPI-acquired resistance (CT26/AR), or B16.F10 melanoma tumors were inoculated into their respective recipient mice. Tumors were allowed to establish, and when they reached 80–110 mm3 (∼10–14 d after the initial inoculation), tumors were excised, dissociated, and the resulting tumor-infiltrating lymphocytes (TILs) were assessed by flow cytometry. Relative cell surface expression of HVEM and DNAM-1 was assessed in NK cells (gated on NKP46+ cells in CT26 tumors and NK1.1 in B16.F10 tumors) and CD8+ T cells (gated on CD3+CD8+ cells).

