
FIGURE 3.
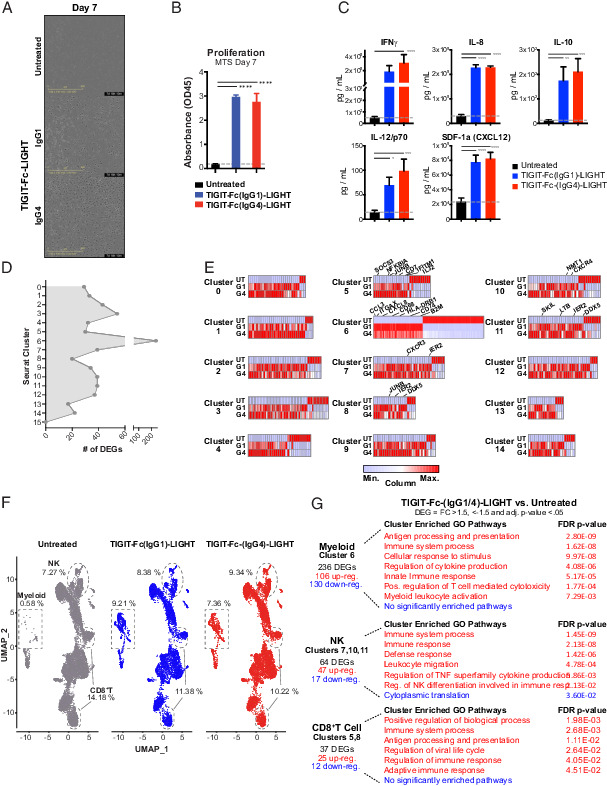
TIGIT-Fc-LIGHT directly activates myeloid, T, and NK cells regardless of Fc composition. Human donor PBMCs were either untreated (UT) or cultured in AIMV media with IgG1 or IgG4 variants of TIGIT-Fc-LIGHT, referred to as TIGIT-Fc(IgG1)-LIGHT or G1 and TIGIT-Fc(IgG4)-LIGHT or G4. (A) Phase contrast images of PBMCs cultured for 7 d with and without G1 or G4 TIGIT-Fc-LIGHT, depicting adherence of cells to the plate and the formation of a spindle-like myeloid morphology. (B) Proliferative capacity was assessed on PBMC cultures incubated for 7 d with and without 150 nM TIGIT-Fc(IgG1)-LIGHT or TIGIT-Fc(IgG4)-LIGHT using the Promega MTS proliferation assay. (C) After 2 d in culture, supernatant was removed and a series of cytokines were assessed using a MSD multiplex cytokine panel. (D) Day 2 PBMC (UT, G1, and G4 treated) single cells were isolated and subjected to single-cell RNA sequencing. Differentially expressed genes (DEGs) were identified between TIGIT-Fc-LIGHT G1/G4 and the untreated group across each of the 16 Seurat clusters identified in (Fig. 1. (E) Heatmaps depicting the relative differences in expression at DEGs identified across all 16 Seurat clusters. Genes of interest are labeled at clusters corresponding to myeloid, NK, and CD8+ T cell populations. (F) UMAP spatial distribution of untreated, TIGIT-Fc(IgG1)-LIGHT, and TIGIT-Fc(IgG4)-LIGHT datasets. The populations of cells that correspond to myeloid, NK, and CD8+ T cells (as identified using ImmuneExp annotations) are highlighted and the percentage of cells falling in those gates across treatment groups are shown. (G) The number and directionality of the DEGs are shown. Gene Ontology analysis (using PANTHER) was performed on the lists of upregulated and downregulated genes, and significantly enriched pathways (false discovery rate p value <0.05) are shown.