FIGURE 5.

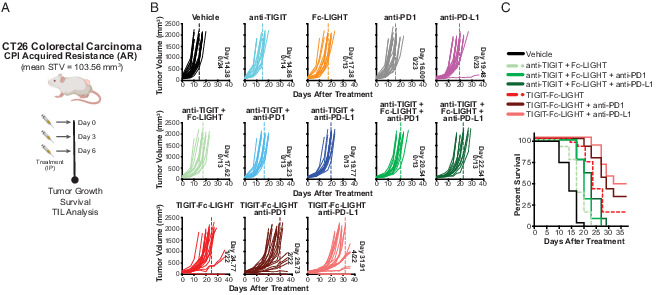
Mouse TIGIT-Fc-LIGHT extends antitumor responses to CPI-acquired resistance tumors through a broad activation of myeloid, CD8+ T, and NK cells. (A) When CT26/AR tumors reached an average starting tumor volume (STV) of 103.56 mm3 (indicating day 0), tumor-bearing mice were given three i.p. injections on days 0, 3, and 6, with each consisting of 200 μg of mTIGIT-Fc-LIGHT, or 100 μg of anti-TIGIT, Fc-LIGHT, anti–PD-1, or anti–PD-L1, or the combinations shown above. (B) Each graph shows individual mouse tumor growth curves, the average day in which the entire group reached tumor burden (also indicated by dotted line), and the number of mice that completely rejected tumors/the total group size analyzed. (C) Kaplan–Meier survival plot through day 36 of the time course.
