FIGURE 6.

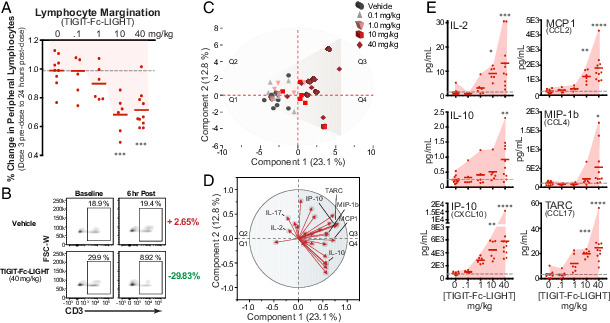
TIGIT-Fc-LIGHT on-target pharmacodynamic activity translates to immunological responses observed in nonhuman primates. (A) Cynomolgus macaques were given 4 weekly i.v. infusions of vehicle or TIGIT-Fc-LIGHT at 0 (10 animals, 0.1 (6 animals), 1.0 (6 animals), 10 (6 animals), and 40 (10 animals) mg/kg. Animals were monitored for various clinical hematology and chemistry parameters during the course of the study. Shown is the percent change in total lymphocyte count from dose 4 predose to 24 h after dose 4 at each individual animal, demonstrating a downward dose-dependent response as lymphocytes are marginating out of the periphery. One-way ANOVA was used for statistical analysis: ***p < 0.001. (B) Flow cytometry was used to assess the frequency of CD3+ T cells (pregated on CD45+ cells) in peripheral blood samples taken at baseline and 6 h after the day 1 infusion. Shown are example animals from the vehicle and TIGIT-Fc-LIGHT 40 mg/kg groups. (C) PCA was used to spatially visualize the distribution of 2-h postdose 2 for each vehicle- and TIGIT-Fc-LIGHT–treated animal, based on the detection levels of a 30-plex nonhuman primate MSD cytokine panel. (D) JMP software was used to generate a vector plot that ranks the influence of particular cytokines on the spatial distribution into each quadrant of the PCA plot in (C). The myeloid-associated cytokines IL-10, IP-10, MCP1, MIP-1β, and TARC, as well as the adaptive immune cytokine IL-2, were shown to be enriched in Q3. (E) The maximum postdose cytokine response is plotted across all dose groups, for each individual animal. Shading was used to highlight the dose response, and one-way ANOVA was used to assess significance: *p < 0.05, **p < 0.01, ***p < 0.001, ****p < 0.0001.
