Figure 2.
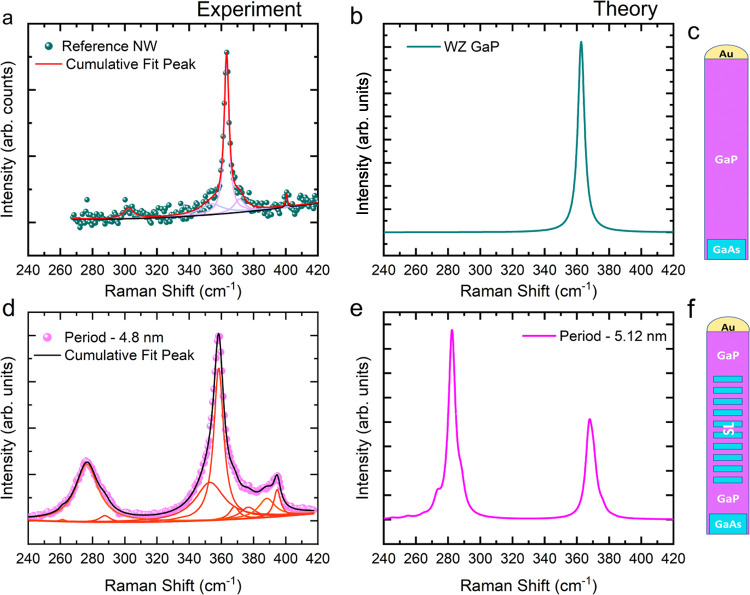
(a) Measured spectrum of GaP from reference NW with the experimental data plotted in green spheres, the cumulative Lorentzian fit is shown in solid red line, the deconvoluted Lorentzian fits are shown in violet curves, and the baseline in black. (b) Calculated spectrum of bulk wurtzite GaP. (c) Schematic of the GaP reference NW from which the spectrum in (a) is obtained. (d) Measured spectrum of a GaAs/GaP SL NW with a period of 4.8 nm with the experimental data shown in magenta spheres and the cumulative Lorentzian fitting in solid black curve; red curves show the deconvoluted Lorentzian fits, and the orange line shows the baseline. (e) Calculated Raman spectrum of a GaAs/GaP SL NW with a period of 5.12 nm. (f) Schematic of the GaAs/GaP SL NW from which the spectrum in (d) is taken.

