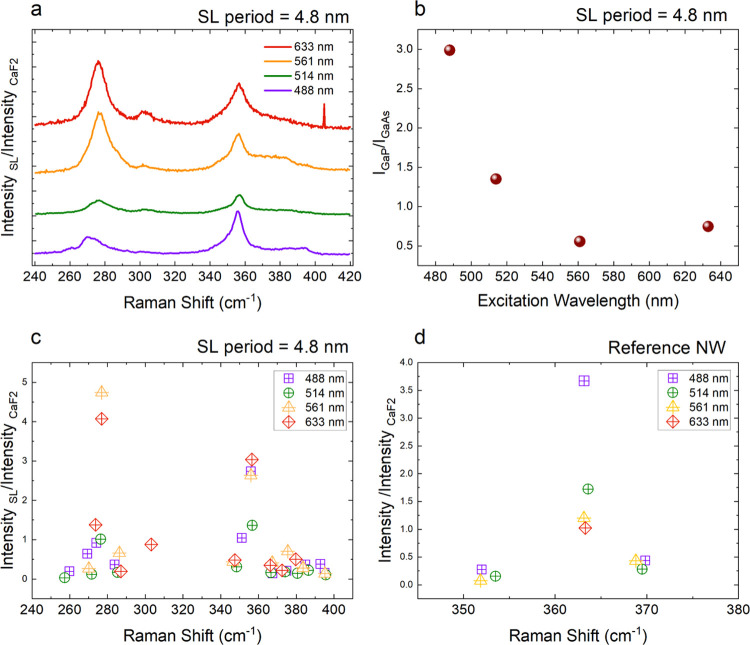
Figure 6.
(a) y-Offset plots of Raman spectra of a 4.8 nm period GaAs/GaP SL NW obtained with 488 nm(violet), 514 nm (green), 561 nm (orange), and 633 nm (red). The individual spectra are normalized using CaF2 Raman intensity for the given excitation wavelength; (b) ratio of intensity of GaP-like mode around 356 cm–1 to intensity of GaAs-like mode around 276 cm–1 as a function of excitation wavelength; (c) intensities (normalized with CaF2 intensity) of different phonon modes as a function of the Raman shift extracted from (a) with same color scheme as in (a); (d) intensities (normalized with CaF2 intensity) of different phonon modes as a function of the Raman shift for a reference NW, with same color scheme as in (a).

